Watchlist 5/11/2022 & Recap

Hello everyone,
I’ve been monitoring crude oil closely the last 3 months, and over the last 2 weeks, I’ve been waiting for it to pull back below $100 levels so I can load up while it’s red. Looks like we may see oil move higher if it holds $100 levels from here. I alerted to everyone on Twitter to watch for this reversal once I saw it hit $99. As I’ve mentioned previously, accumulate oil trades, don’t chase the spikes. The main ones to watch are the ones still above $1. Anything below $1, be very careful. I’d pay attention to INDO (1st gap to $23), HUSA (1st gap to $5), and ENSV (1st gap to $3.50). I am focused on these ones because of the float size, and the fact that they’re still above $1. Those under $1 are risky right now due to so many companies getting delisted. I listed all oil stocks at the very bottom of this post for those who want to do some DD.

Manage Risks & Trading Plan
These are my trading plans, and many ask if I’m holding this or that. If it breaks any of the dip zones that I mention or if it breaks the trend line for a swing on the 5D/30D chart, I will respect my rules and I will respect my stop loss and wait for the setup to re-enter. Never bag hold, never average down on a loser UNLESS you’re confident it will reverse, and never turn a day trade into a swing if you do not have a set plan. For those under PDT, be careful with setting up swings too early in the day; I prefer waiting until after lunch (EST) to set my swings up (unless it hit my perfect dip zone). Always make sure you have a day trade available in case you need to exit and reposition. It’s okay to be wrong, but it’s not okay to stay wrong. Hope doesn’t make us money; proper risk management does.
Many of these are great long term plays if one was to load up on red days while respecting the trend line for setting up swings. There’s nothing wrong with buying on green days if buying the BIG pullbacks. Best way to get burned is to chase while they’re ripping upward.
I do NOT hold all stocks listed below. I provide a list of top mentions/trending/abnormal volume movers/upcoming catalysts/earnings/conservative large caps. You decide what you trade based on your preference.
5/11/22 Main Watch
If the market is red, consider respecting your stop losses. Stopping out doesn’t mean you’re unable to re-enter; it’s you giving yourself the best setup while managing your risks, and maximizing profit potential. Waiting for confirmation is crucial once it hits the dip zones; I would never just jump in and buy. It’s important they hold at the dip zone levels. If it breaks below, I typically wait for it to reclaim that dip zone before scaling in.
VRM
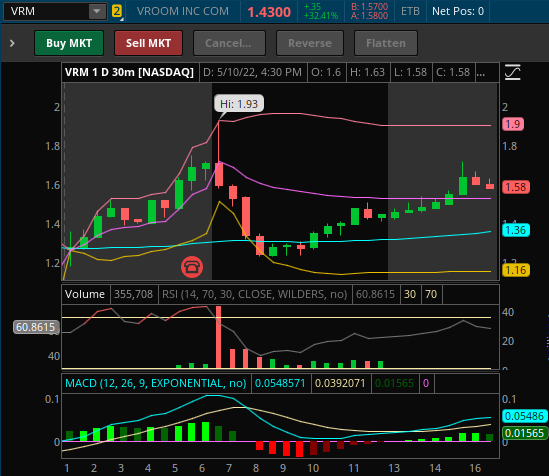
VRM hit high of day (HOD) $1.93 after the market open, triggered SSR for today and Wednesday 5/11, faded to low of day (LOD) $1.23, and started moving uoward into the close, closing at $1.43, and hitting $1.72 after hours (AH). If there is another pullback, watch for the dip zone to be at $1.28-$1.54 levels. Short Interest is 30.79% of float as of 4/15/22. Based on 12 analysts, there is a high PT of $51, low PT of $2, and average PT of $8.71.
CYN
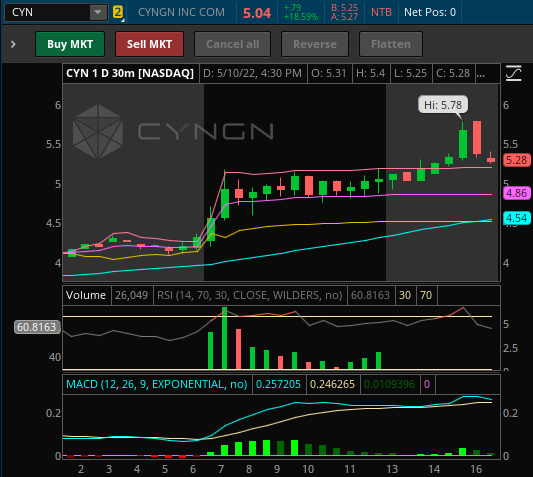
CYN hit a low of day (LOD) $3.74 premarket and high of day (HOD) $5.78 after hours (AH). If there is a pullback, look for the first dip zone to be in the $$4.86-$5.20 levels. Due to the volatility, if it breaks that dip zone, watch for the next one at $4.53-$4.67 levels. Short Interest is 1.53% of float as of 4/15/22. Based on an Analyst, there is a PT of $13. Earnings will be reported on 5/11 after hours.
RDBX
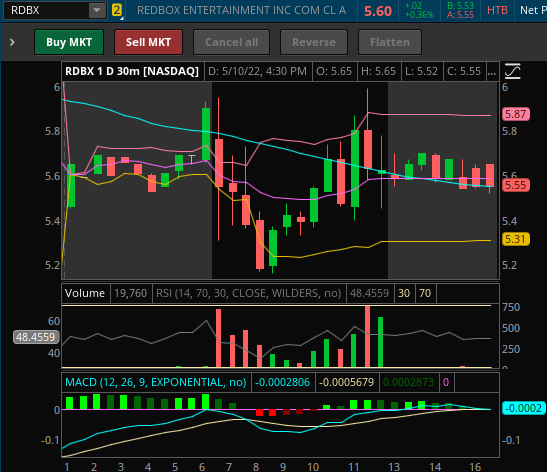
RDBX hit a low of day (LOD) $5.16 and high of day (HOD) $5.99, closing at $5.60. If there is a pullback, look for the dip zone to be in the $5.25-$5.46 levels. Short Interest is 11.31% of float as of 4/15/22. Based on 4 Analysts, there is a high PT of $10, low PT of $3, with an average PT of $5.25.
BTTX

BTTX hit a high of day (HOD) $2.43 intraday and low of day (LOD) $1.90. If there is a pullback, look for the dip zone to be in the $1.88-2.05 levels. Short Interest is 0.67% of float as of 4/15/22. Based on 4 Analysts, high PT is $21, low PT is $15, average PT is set at $17.67.
BBIG
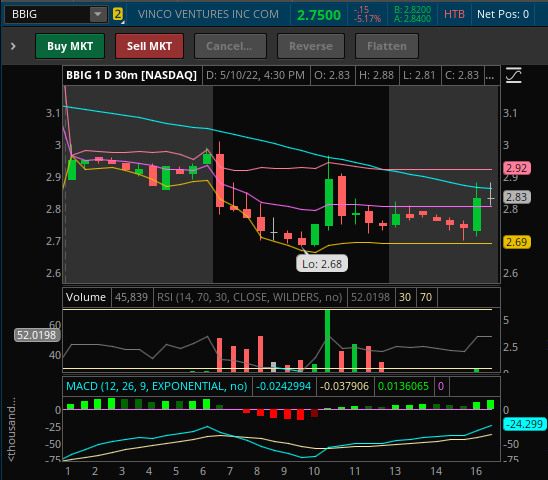
BBIG hit high of day (HOD) $3.01, and a low of day of $2.68. BBIG moved back to $2.88 levels after hours (AH). If there is another pullback, watch for the dip zone to be at $2.70-$2.80 levels. Short Interest is 14.95% of float as of 4/15/22. It is definitely higher now going into 5/18. I’m swinging and will be holding at the closing date for my Cryptide shares that will be distributed to Vinco shareholders on 5/27. Some have asked how high this can go, I’ve been in every big run as I’ve mentioned previously. If we can reclaim $4, then $5.50, then $7.50, above $12 will be possible. We have to form higher lows so we can get there.
SKYH
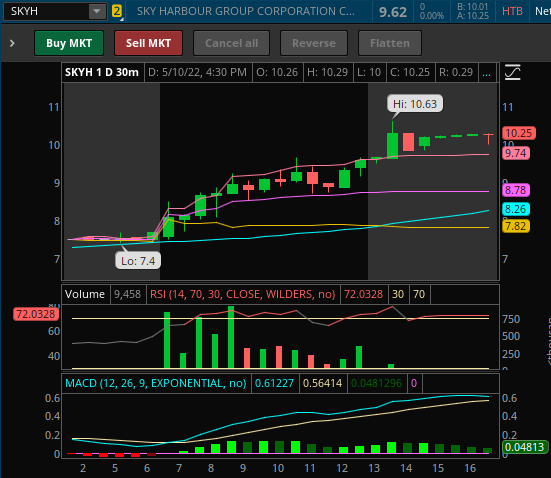
SKYH hit low of day (LOD) $7.40 premarket and high of day (HOD) $10.63 after hours. If there is a pullback, watch for the first dip zone at $9.56-$9.74. If it breaks below, watch for the second dip zone at $8.50-$8.78 levels. Short Interest is 0.96% of float as of 4/15/22.
5/10/22 Setups Pre- and Post- Reviews
I’ll be posting pre- and post- charts to see if our plan worked. I’ll show the percent changes from the dip zones so that you can see how there are plenty of gains to be made even in the small moves. It’s up to you when you take your profits. These will be used as archives so I can refer back to the chart year over year. This will also be used as learning tools to see where we went wrong so we can figure out the best way to maximize profits and manage risks. If none of these have moved yet, watch for the move to come in the coming weeks.
AMC

AMC hit low of day (LOD) $12.43, and ran to $13.50 after AMC reported earnings, closing +2.50% after hours (AH). AMC will need to reclaim $14 levels for a bullish move back up. If the market continues to be red, then watch for the dip zone to be at $12.15-$12.45.

AMC didn’t hit my dipzone ($12.15-$12.45), but was able to hold well above, dipping to $12.81 premarket, and moving up $1.20 (9.37%) to high of day (HOD) $14.01 after the market opened. After it hit its highs, it became heavily shorted again, knifing down, and then fading to low of day (LOD) $11.50. It was able to reclaim my dipzone level, but unable to hold and consolidate at that level. AMC closed at $11.84.
BBIG
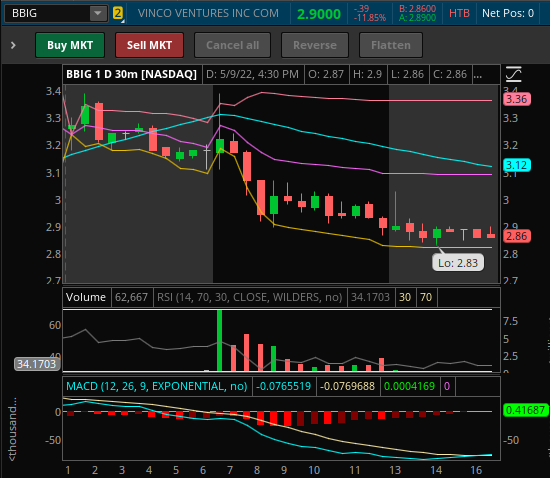
BBIG hit premarket highs at $3.39, followed by hitting premarket lows $3.11, followed by intraday high of day (HOD) $3.39. BBIG ended up fading along with the rest of the market, hitting low of day (LOD) $2.83 after hours (AH). BBIG will be under SSR tomorrow, so if there is another pullback, watch for the dip zone to be at $2.65-$2.80 levels. I’m going to keep swinging long, repositioning day by day until 5/18.

BBIG hit HOD $3.01 at the open, and then hit my dipzone ($2.65-$2.80) $2.68 (✔) intraday, and was able to move up $0.29 (10.82%) to $2.97, and closing at $2.75.
MDVL
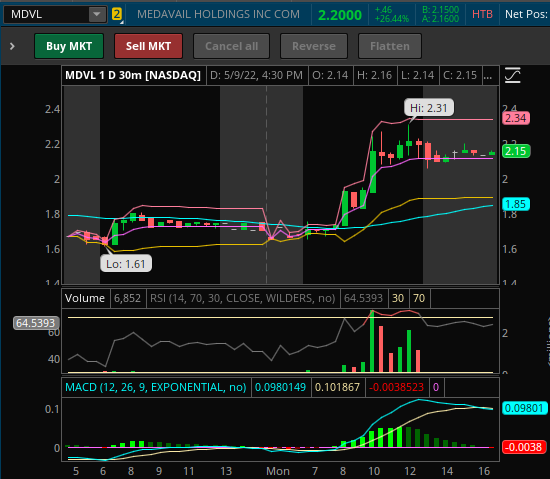
MDVL hit high of day (HOD) and closed at $2.20. If there is a pullback, watch for the dipzone to be at $1.98-$2.10. MDVL needs to reclaim $2.50 for a bullish move up.

MDVL hit $0.01 above my dipzone ($1.98-$2.10) $2.11 (✔) premarket, and was able to move up $0.35 (16.59%) to $2.46 after the market open, followed by a fade and 2 small bounces at my dipzone again, once at $2.07, and a $0.15 (7.25%) cimb to $2.22, and again towards the close, hitting intraday low of day (LOD) $2.03 (✔), closing at $2.10, and climbing back up $0.19 (9.36%) to $2.22 after hours.
VERU
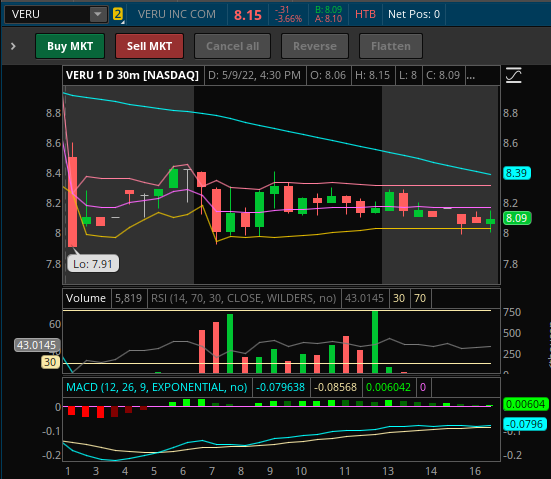
VERU hit low of day (LOD) $7.91 premarket and closed at $8.15. If there is a pullback, watch for the dipzone to be at $7.45-$7.75. VERU needs to reclaim $9.15-$9.30 levels for a bullish move up.

VERU hit premarket highs at $8.50, then flushed down to my dipzone ($7.45-$7.75) $7.64 (✔) intraday, and was able to move up $0.50 (6.54%) to $8.14, closing at $7.79.
CYN

CYN hit low of day (LOD) $3.41 premarket, high of day (HOD) $4.62, and closed at $4.25. If there is a pullback, watch for the dipzone to be at $3.60-$3.80. CYN needs to reclaim $5 levels for a bullish move up.

CYN, my multi week swing has been very consistent. It hit my dipzone ($3.60-$3.80) at $3.74 (✔) premarket, and was able to move up $2.04 (54.55%) to $5.78 after hours. CYN closed at $5.04.
BTTX
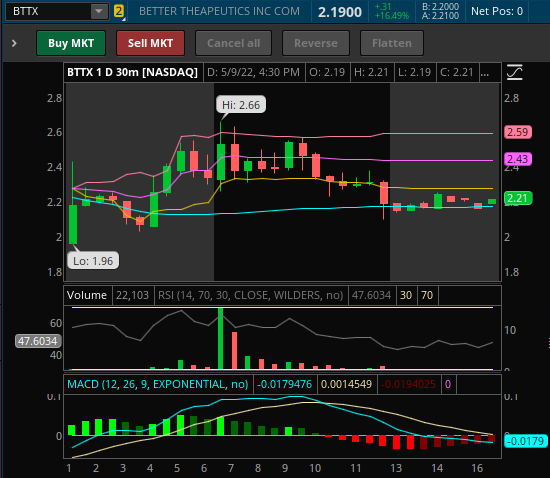
BTTX hit low of day (LOD) $1.96 premarket, high of day (HOD) $2.66, and closed at $2.19. If there is a pullback, watch for the dipzone to be at $1.97-$2.19 levels. BTTX needs to reclaim $2.75 levels and consolidate, forming higher lows, for a bullish move up.

BTTX hit $0.01 below my dipzone ($1.97-$2.19) $1.96 (✔) premarket, and was able to move up $0.47 (23.98%) to $2.43 intraday, closing at $2.09.
Others to Watch/Trending
- RIBT
- SBFM
- MULN
- FCEL
- PIK
- BOLT
- GME
- ITP
- GFAI
- NILE
Oil Stocks to Watch for a Reversal
If trading oil, make sure you’re monitoring crude oil prices. Only load up on red days. If you chase the day it runs, you’re already too late. Your chances of losing money is much higher since it’s more volatile. Unless you’re a strong day trader, I would not try scalping an oil play. There are better setups elsewhere.
- INDO – 7.36% SI as of 4/14/22
- HUSA – 5.25% SI as of 4/14/22
- ENSV – 4.18% SI as of 4/14/22
- CEI – 8.57% SI as of 4/14/22
- USWS – 10.71% SI as of 4/15/22
- MXC – 3.34% SI as of 4/14/22
- MARPS – 1.48% SI as of 4/15/22
- IMPP – unknown SI
Earnings
5/11/22
- RIVN
- CPNG
- KGC
- DIS
- PSFE
- BMBL
- WEN
- SONO
- VET
- BYND
- SAND
- BROS
- EVGO
- FVRR
- PFGC
- YETI
- ICL
- ATC
- DNUT
- MCFT
5/12/22
- CPG
- AFRM
- JOBY
- VERU
- ACB
- TPR
- BKKT
- HIMX
- FIGS
- BAM
- SIX
- INDI
- USFD
- MSI
- CYBR
- IMMR
- DAVA
5/13/22
- HIPO
- MUX
- HNST
- HUMA
- BFRI
- SDPI
- LFMD
- PLXP
- IMV
- NYC
Many have asked how to support me directly, you can open up a Webull Account with my referral link that’s on the sidebar & homepage or you can donate to my blog below via PayPal. Every bit helps to keep my blogging dream alive. I truly appreciate you taking the time to read.
-Cheers
Disclaimer : This should not be considered investment advice, and should not be used to make investment decisions. Do not buy or sell any stock without conducting your own due diligence. Information on eyelovegains.com is opinionated and should be considered for information purposes only. No stock exchange anywhere has approved or disapproved the information contained herein. There is no express or implied solicitation to buy or sell securities. The charts and data provided here are not meant for investment purposes and only serve as examples. We are not liable for any losses you may endure from the buying and selling of stocks or securities within your accounts.