5/10/22 Watchlist
Hello everyone,
Hope you all started Monday off right. The majority of the market continued to stay red. For those who are not accustomed to trading in a bear market, you need to keep your % goal realistic. If you’re a bull or long, this is not the time to look for 40% runs. As long as you stay conservative, 5-20% gains, you should be fine. Keeping position size conservative is key to surviving in this type of market. I am still only trading with 5% of my money, and scaling out my profits.
401K Risk Management
For those with 401Ks, it would be smart to reduce contributions down to 1% or the bare minimum if you have an employer match plan. There’s a time to capitalize on return on investment (ROI) and there’s a time to scale back; this is one of the times protecting your retirement accounts would be a smart idea. If you have an old 401K sitting around, it would be strategic to move that money out if its YTD % is not serving your needs.
Requesting a rollover to an IRA would be the best thing you could do ESPECIALLY if you are near retirement, BUT it depends on your financial situation. Look at the pros and cons at this point in time. If there’s a chance your 401K can drop another 40-50% with everything going on, maybe getting hit with 10-20% penalties MIGHT be worth it if you don’t have 5-10 years for the market to recover. Unless you’re in a situation where it’s advantageous to leave your money due to credit and bankruptcy protections, leaving funds in a 401k as protection from creditors under IRA rules, then you need to think about what’s best for you and your portfolios. Consult with your account managers.
Once the market bottoms out, you can take advantage of re-contributing that money again, increasing contributions, and still taking full advantage of your employer match programs.
Manage Risks & Trading Plan
These are my trading plans, and many ask if I’m holding this or that. If it breaks any of the dip zones that I mention or if it breaks the trend line for a swing on the 5D/30D chart, I will respect my rules and I will respect my stop loss and wait for the setup to re-enter. Never bag hold, never average down on a loser UNLESS you’re confident it will reverse, and never turn a day trade into a swing if you do not have a set plan. For those under PDT, be careful with setting up swings too early in the day; I prefer waiting until after lunch (EST) to set my swings up (unless it hit my perfect dip zone). Always make sure you have a day trade available in case you need to exit and reposition. It’s okay to be wrong, but it’s not okay to stay wrong. Hope doesn’t make us money; proper risk management does.
Many of these are great long term plays if one was to load up on red days while respecting the trend line for setting up swings. There’s nothing wrong with buying on green days if buying the BIG pullbacks. Best way to get burned is to chase while they’re ripping upward.
I do NOT hold all stocks listed below. I provide a list of top mentions/trending/abnormal volume movers/upcoming catalysts/earnings/conservative large caps. You decide what you trade based on your preference.
5/10/22 Main Watch
If the market is red again, consider respecting your stop losses. Stopping out doesn’t mean you’re unable to re-enter; it’s you giving yourself the best setup while managing your risks, and maximizing profit potential. Waiting for confirmation is crucial once it hits the dip zones; I would never just jump in and buy. It’s important they hold at the dip zone levels. If it breaks below, I typically wait for it to reclaim that dip zone before scaling in.
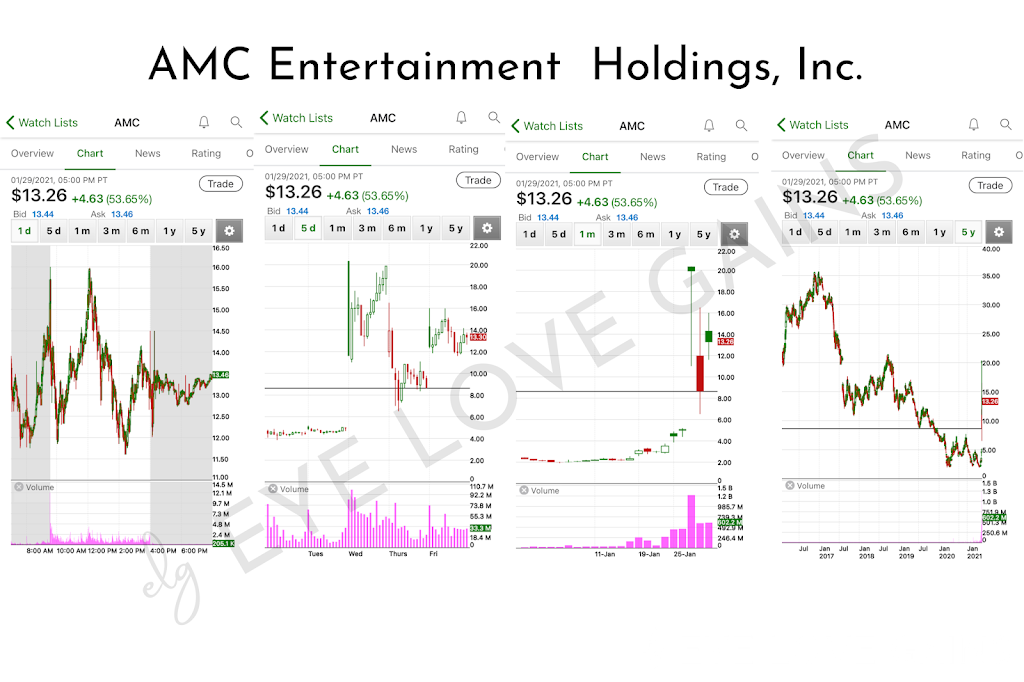
AMC

AMC hit low of day (LOD) $12.43, and ran to $13.50 after AMC reported earnings, closing +2.50% after hours (AH).
AMC reported earnings here,
• Total revenues grew to $785.7 million compared to $148.3 million for the first quarter of 2021.
• Net loss improved to $337.4 million compared to a net loss of $567.2 million for the first quarter of 2021.
• Adjusted EBITDA improved by $233.0 million to a loss of $61.7 million compared to a loss of $294.7 million for
the first quarter of 2021.
• Available liquidity at March 31, 2022 was $1,376.0 million.
AMC will need to reclaim $14 levels for a bullish move back up. If the market continues to be red, then watch for the dip zone to be at $12.15-$12.45.
BBIG
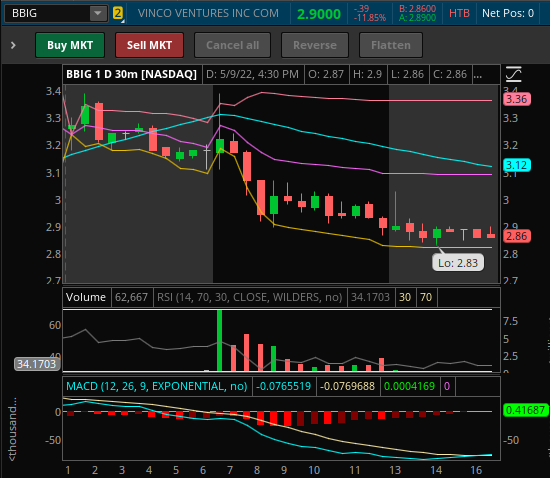
BBIG hit premarket highs at $3.39, followed by hitting premarket lows $3.11, followed by intraday high of day (HOD) $3.39. BBIG ended up fading along with the rest of the market, hitting low of day (LOD) $2.83 after hours (AH). BBIG will be under SSR tomorrow, so if there is another pullback, watch for the dip zone to be at $2.65-$2.80 levels. I’m going to keep swinging long, repositioning day by day until 5/18.
MDVL
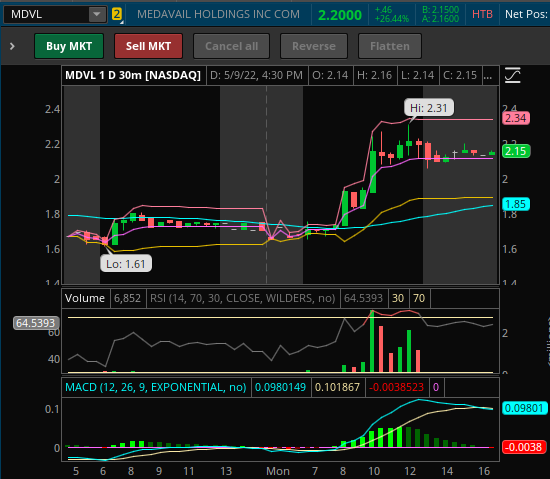
MDVL hit high of day (HOD) and closed at $2.20. If there is a pullback, watch for the dipzone to be at $1.98-$2.10. MDVL needs to reclaim $2.50 for a bullish move up.
VERU
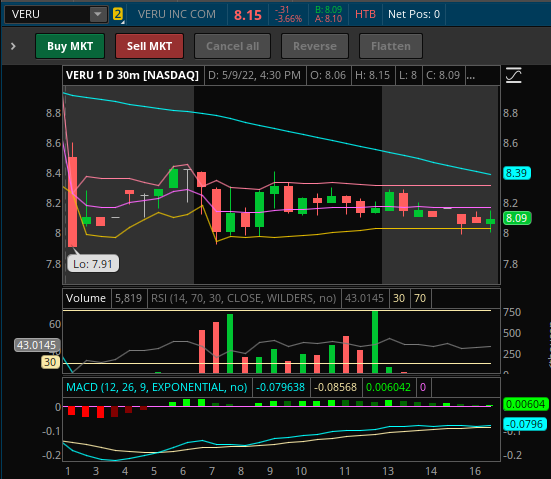
VERU hit low of day (LOD) $7.91 premarket and closed at $8.15. If there is a pullback, watch for the dipzone to be at $7.45-$7.75. VERU needs to reclaim $9.15-$9.30 levels for a bullish move up.
CYN

CYN hit low of day (LOD) $3.41 premarket, high of day (HOD) $4.62, and closed at $4.25. If there is a pullback, watch for the dipzone to be at $3.60-$3.80. CYN needs to reclaim $5 levels for a bullish move up.
BTTX
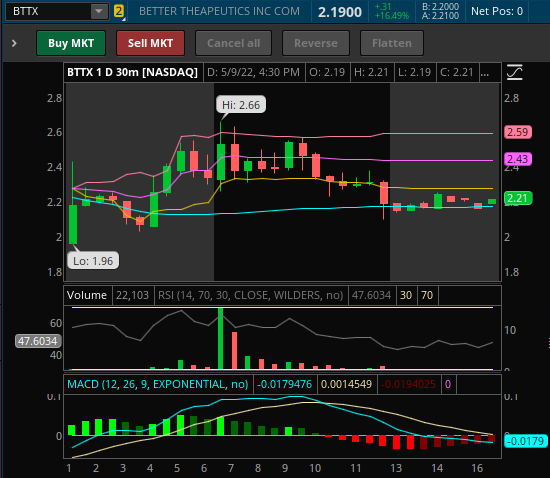
BTTX hit low of day (LOD) $1.96 premarket, high of day (HOD) $2.66, and closed at $2.19. If there is a pullback, watch for the dipzone to be at $1.97-$2.19 levels. BTTX needs to reclaim $2.75 levels and consolidate, forming higher lows, for a bullish move up.
5/9/22 Setups Pre- and Post- Reviews
I’ll be posting pre- and post- charts to see if our plan worked. These will be used as archives so I can refer back to the chart year over year. This will also be used as learning tools to see where we went wrong so we can figure out the best way to maximize profits and manage risks. If none of these have moved yet, watch for the move to come in the coming weeks.
CYN
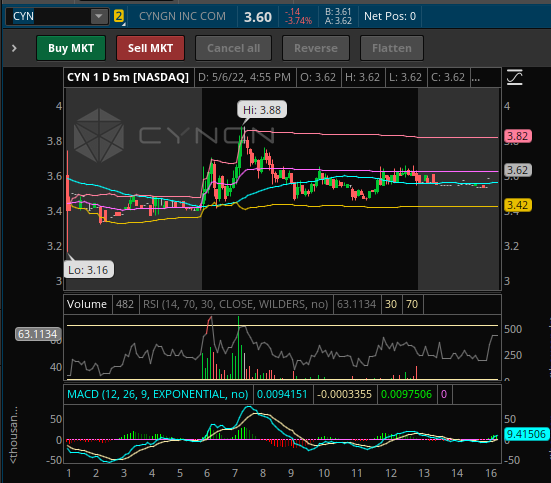
CYN hit a low of day (LOD) $3.16 premarket and high of day (HOD) $3.88 intraday. If there is a pullback, look for the dip zone to be in the $3.34-3.49 levels. Short Interest is 1.53% of float as of 4/15/22. Based on 1 Analyst, the PT is set at $13.

CYN hit low of day (LOD) $3.41 (✔) premarket, followed by a high of day (HOD) $4.62 intraday, and fading back to $4-$4.20 levels into the close.
AMC

AMC hit a low of day (LOD) $13.52 intraday after hitting high of day (HOD) $14.84 at the open. AMC will report earnings for Q1. If there is a pullback, look for the dip zone to be in the $13.07-13.35 levels. Short Interest is 19.35% of float as of 4/14/22. Based on Analysts, highest PT is $35.10, lowest PT is $1, with an average PT of $10.09.
AMC hit my dipzone ($13.07-$13.35) $13.35 (✔) premarket, and was able to move up $0.37 to $13.72 before the market open, however, the market flush was too strong, causing it to break below the dipzone and fading into a low of day (LOD) $12.43 into the close, closing at $12.52.
AMC reported earnings here,
• Total revenues grew to $785.7 million compared to $148.3 million for the first quarter of 2021.
• Net loss improved to $337.4 million compared to a net loss of $567.2 million for the first quarter of 2021.
• Adjusted EBITDA improved by $233.0 million to a loss of $61.7 million compared to a loss of $294.7 million for
the first quarter of 2021.
• Available liquidity at March 31, 2022 was $1,376.0 million.
The market sentiment was a bit lackluster due to the overall red day, but AMC was able to hit $13.50 after hours (AH), closing +2.40%.
ATER

ATER hit a high of day (HOD) $4.80 premarket and low of day (LOD) $4.24 intraday before the close. ATER reclaimed $4.60 levels after hours (AH). If there is a pullback, look for the dip zone to be in the $4.22-4.39 levels. Short Interest is 18.57% of float as of 4/15/22. Based on 6 Analysts, the average PT is set at $7.17, with a high PT of $15 and low PT of $2.50.
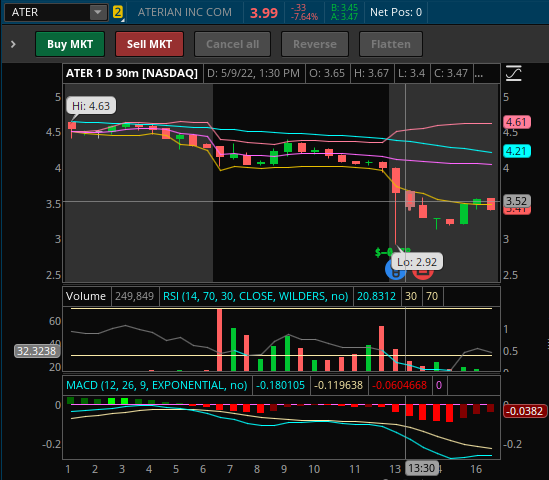
ATER hit high of day (HOD) $4.63 premarket and broke below my dip zone ($4.22-$4.39) hitting intraday low of day (LOD) $4.02, followed by hitting intraday high of day (HOD) $4.39, attempting to reclaim my dip zone, consolidating, but there wasn’t enough to push it from moving upward, especially in a red market and heading into earnings after hours.
ATER reported 2022 Q1 earnings here.
- Net revenue declined 13.3% to $41.7 million, compared to $48.1 million in the first quarter of 2021.
- Gross margin improved to 56.6%, compared to 54.1% in the first quarter of 2021.
- Contribution margin declined to 9.2% from 12.7% in the first quarter of 2021, primarily due to global supply chain disruptions and inflation.
- Operating loss of $(36.3) million declined, compared to a loss of $(27.8) million in the first quarter of 2021.
- Net loss of $(42.8) million improved from $(82.6) million in the first quarter of 2021.
- Adjusted EBITDA decreased to $(4.5) million from $(1.2) million in the first quarter of 2021.
- As planned, due to supply chain concerns, no new products were launched in the first quarter of 2022 compared with 21 in the first quarter of 2021.
- Total cash balance at March 31, 2022 was $44.3 million.
ATER hit low of day (LOD) $2.92 after hours (AH) after reporting poor earnings. It was able to reclaim $3.30 levels and closed at $3.41.
BBIG
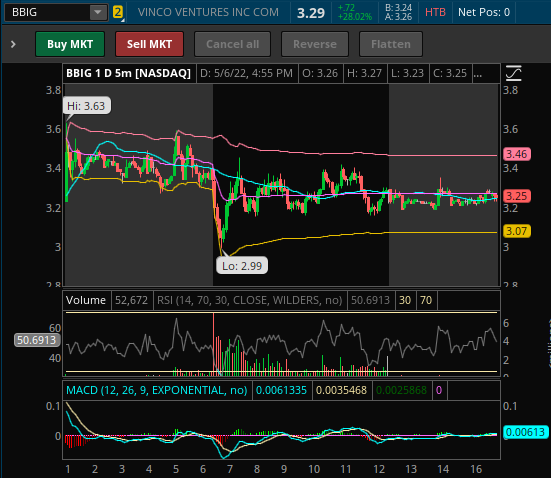
BBIG hit a high of day (HOD) $3.63 premarket, and low of day (LOD) $2.99 intraday. If there is a pullback, look for the dip zone to be in the $3.10-$3.25 range. There will be bullish momentum leading up to 5/18/22, so if there are ANY red days leading up to that date, that will be the best time to load up. Make sure you HOLD through 5/18 because the dividend of shares related to the Cryptyde deal will be distributed on 5/27. Short Interest is 11.31% of float as of 4/15/22, although I do believe it’s MUCH higher than what is being reported.
BBIG hit premarket highs at $3.39, followed by hitting my dip zone ($3.10-$3.25) at $3.11 (✔) during premarket/morning flush, followed by intraday high of day (HOD) $3.39. BBIG ended up fading along with the rest of the market, hitting low of day (LOD) $2.83 after hours (AH).
RDBX
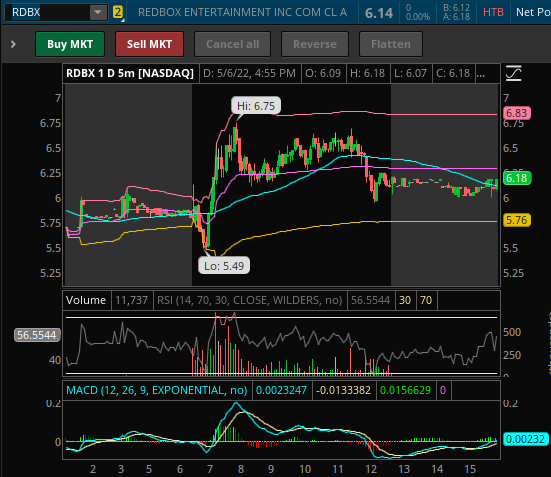
RDBX hit a low of day (LOD) $5.49 and high of day (HOD) $6.75. If there is a pullback, look for the dip zone to be in the $5.76-$6.07 levels. Short Interest is 11.31% of float as of 4/15/22. Based on 4 Analysts, there is a high PT of $10, low PT of $3, with an average PT of $5.25.
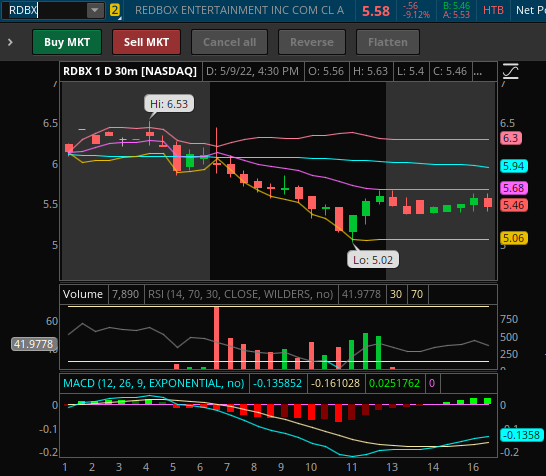
RDBX hit within $0.02 of my dipzone ($5.76-$6.07) at $6.09 (✔) premarket, followed by new highs at $6.53 premarket, making a +$0.44 move. RDBX ended up fading throughout the day after the market opened, hitting a low of day (LOD) $5.02.
BTTX
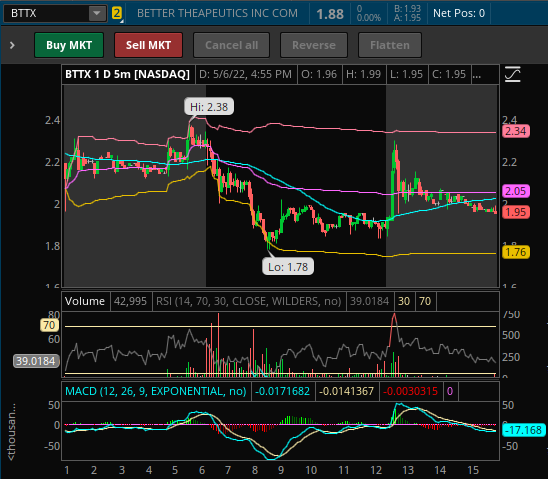
BTTX hit a high of day (HOD) $2.38 premarket and low of day (LOD) $1.78. BTTX is under SSR Monday. If there is a pullback, look for the dip zone to be in the $1.83-2.18 levels. Short Interest is 0.67% of float as of 4/15/22. Based on 4 Analysts, high PT is $21, low PT is $15, average PT is set at $17.67.

BTTX hit my dipzone ($1.83-$2.18) at $1.96 (✔) during premarket hours, hitting high of day (HOD) $2.66 intraday at the open.
AMD

AMD hit a low of day (LOD) of $92.61 premarket and high of day (HOD) intraday at $98.18. If there is a pullback, look for the dip zone to be in the $91-95 levels. Short Interest is 1.70% of float as of 4/15/22. Based on 44 Analysts, the higher end of the Price Targets is set at $200, lower end $97, with an average PT $137.59.

AMD hit my dip zone at ($91-95) at $91.64 (✔), followed by a high of day (HOD) 93.74, but was unable to hold and consolidate, fading downward along with the rest of the market.
Others to Watch/Trending
- XELA
- RIBT
- OST
- SOPA
- CSCW
- SBFM
- PHUN
- DWAC
- MULN
- FCEL
- HYMC
- PIK
- BRQS
- BOLT
- GME
- ITP
- GFAI
- NILE
Oil Stocks to Watch for a Reversal
If trading oil, make sure you’re monitoring crude oil prices. Only load up on red days. If you chase the day it runs, you’re already too late. Your chances of losing money is much higher since it’s more volatile. Unless you’re a strong day trader, I would not try scalping an oil play. There are better setups elsewhere.
- INDO
- HUSA
- IMPP
- ENSV
- CEI
- USWS
- MXC
- MARPS
Earnings
5/10/22
- SOFI
- OXY
- RBLX
- NCLH
- PTON
- BHC
- TTD
- COIN
- MTTR
- ARRY
- WKHS
- RKT
- WYNN
- BLDR
- AUPH
- SYY
- CRON
- VFF
5/11/22
- RIVN
- CPNG
- KGC
- DIS
- PSFE
- BMBL
- WEN
- SONO
- VET
- BYND
- SAND
- BROS
- EVGO
- FVRR
- PFGC
- YETI
- ICL
- ATC
- DNUT
- MCFT
5/12/22
- CPG
- AFRM
- JOBY
- VERU
- ACB
- TPR
- BKKT
- HIMX
- FIGS
- BAM
- SIX
- INDI
- USFD
- MSI
- CYBR
- IMMR
- DAVA
5/13/22
- HIPO
- MUX
- HNST
- HUMA
- BFRI
- SDPI
- LFMD
- PLXP
- IMV
- NYC
Many have asked how to support me directly, you can open up a Webull Account with my referral link that’s on the sidebar & homepage or you can donate to my blog below via PayPal. Every bit helps to keep my blogging dream alive. I truly appreciate you taking the time to read.
-Cheers
Disclaimer : This should not be considered investment advice, and should not be used to make investment decisions. Do not buy or sell any stock without conducting your own due diligence. Information on eyelovegains.com is opinionated and should be considered for information purposes only. No stock exchange anywhere has approved or disapproved the information contained herein. There is no express or implied solicitation to buy or sell securities. The charts and data provided here are not meant for investment purposes and only serve as examples. We are not liable for any losses you may endure from the buying and selling of stocks or securities within your accounts.