End of Day Wrap Up 02/24/2021
Happy Wednesday everyone! Today the rainbow came out after the storm. I was down roughly -20-25% in most of my positions yesterday, but today was redemption day. Three of my accounts finally broke its red/neutral streak over the last month primarily due to AMC, GME, SNDL, and OCGN pulling my overall portfolios down. So today my portfolios regained between 1) +9% 2) +38% 3) +52%.
Highlight of the Day
I mentioned previously to consider accumulating GME, AMC, and SNDL when the news, furus, and new traders stop pumping. As usual, I published my watchlist so everyone had a few weeks to accumulate and set up their positions early. It’s important to accumulate and buy when the positions are dead on volume. Once again, patience paid off. Furus who told other traders to sell and analysts who tried to analyze the charts were wrong again. I trade what’s in front of me, not what others tell me. Because I swing long, I’m accustomed to seeing many red days with these stocks over the last year. I knew the moment my account dipped hard, a run was coming soon.
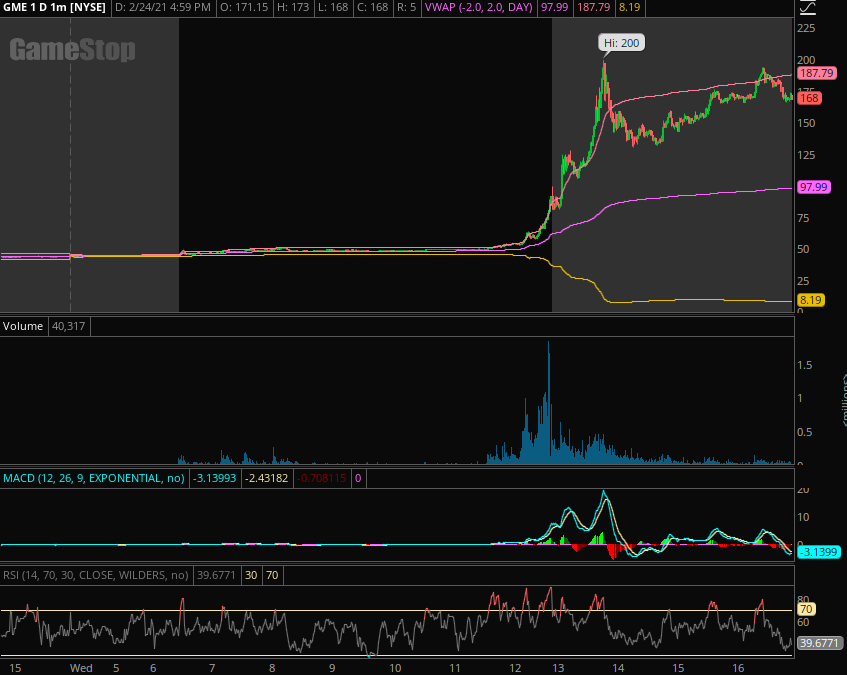
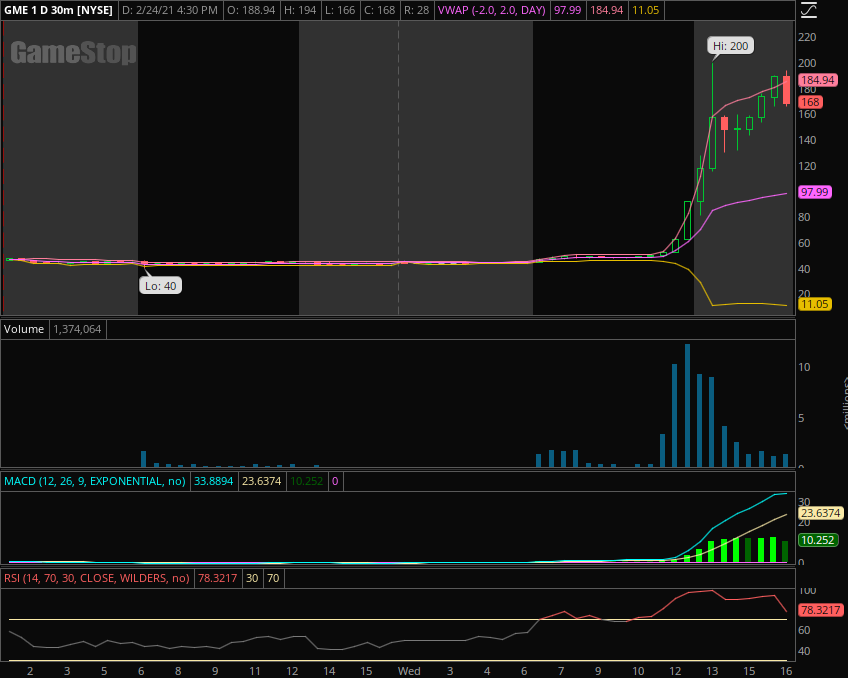
GameStop Corp

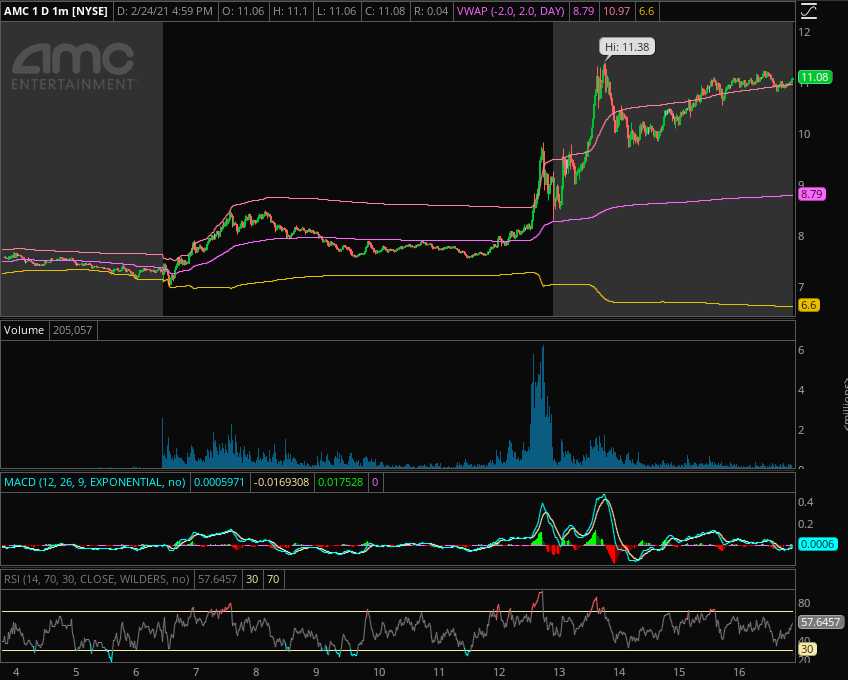
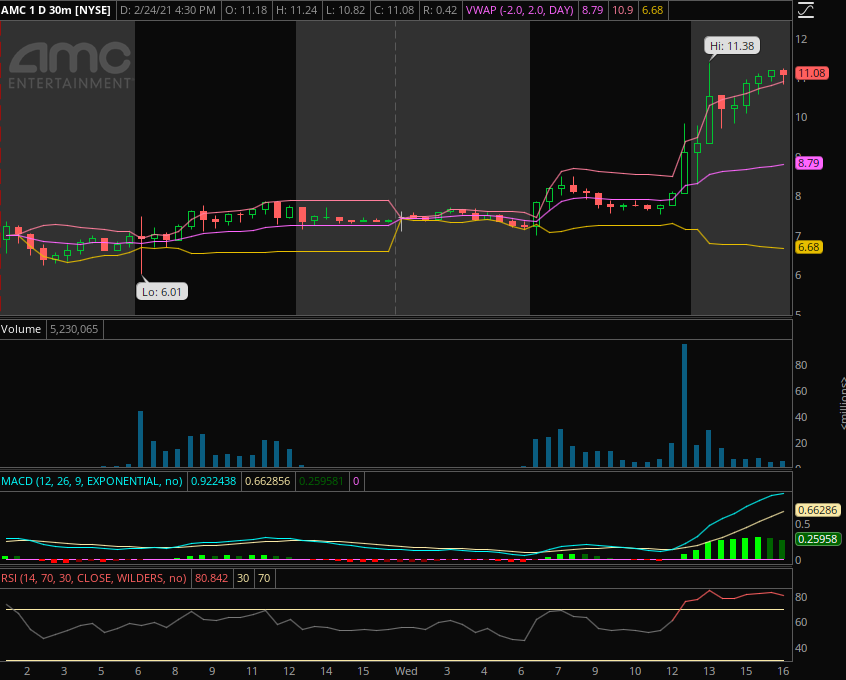
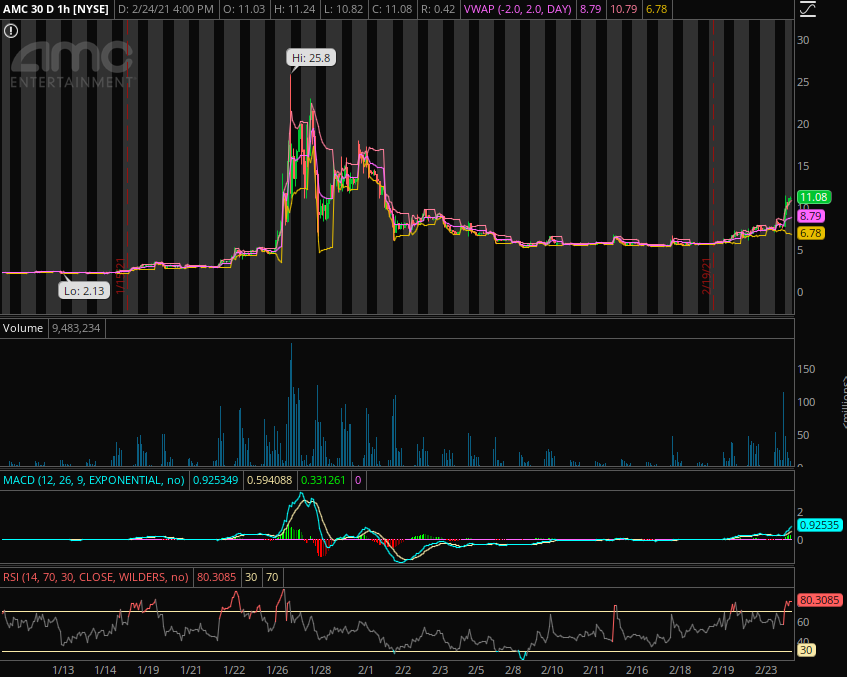
AMC Entertainment (AMC)
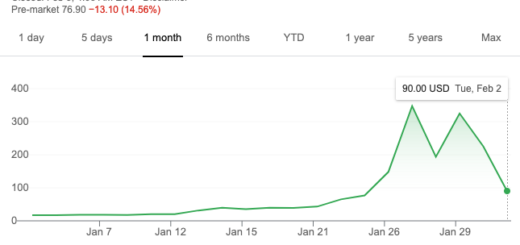
Sundial Growers Inc (SNDL)

What to Watch for Tomorrow
I will be watching for a gap up in GME, AMC, SNDL, SOS, ITRM, and SANP. I’m waiting for HCMC to shake out the last of the impatient traders so we can run back up. I’m expecting HCMC to run above $0.005 > $0.01…>+ in the next few months and SANP to run above $0.05 > $0.10 >…+. I added WKHS yesterday during the huge sell off at $12.97, and it looks like it shook many traders out early after a bloody day yesterday. I expect a reversal back up, which typically takes a few weeks, but with the after hours movement, it looks like a reversal may be coming sooner, as it’s clearly oversold. For SOS, the after hours action got my attention, so I added for a reversal back up on that one as well. It looks like CLOV would be a good add at this bottom for those needing to average down from entering at the high. As always scaling is crucial and having that lifeline there to move money is key to being successful. We shall see what happens tomorrow, but regardless of what happens, I hope you all end this week super green.
How to Utilize My Positions List Below
Many ask how to utilize my top 10 green/red position lists below. Oftentimes, I will exit my green swing positions if it looks like there will be no continuation. My decision varies depending on what my cost price is. It’s all about managing risks, and if it looks like I’ll be in a position where, I’ll be down, I won’t hold, and will choose to reposition myself by accumulating dips on red days over a period of time until it’s ready for the next run.
To Buy On Green Days or Not
I will add to my green positions on green days only if it’s moving in the direction I like and forming higher lows, and showing a bullish chart. I make sure to scale when adding, especially on green days, because it can go south quickly.
To Buy on Red Days or Not
I will almost always accumulate my red positions because they usually move back up, unless it’s a clear pump and dump, which I will never swing because it’s too risky. If there are sharp spikes and a quick drop down, then it’s a clear pump and dump. If the chart slowly drops in price throughout the day, then that’s usually people taking profits. To make the call on re-entering or accumulating, I look at the 5D, 10D, 30D, 90D, 180D charts and I monitor the volume. I love adding when there’s little to no volume when setting up long swings.
Top 10 Green Positions (02/24/21):
- GME
- TSOI
- SANP
- SNDL
- MARA
- TLRY
- AMC
- AQMS
- ACST
- HAON
Top 10 Red Positions (02/24/21):
- MMEX
- HCMC
- BLIAQ
- GAXY
- PTON
- NVAX
- LYL
- SOS
- IBIO
- GTEH
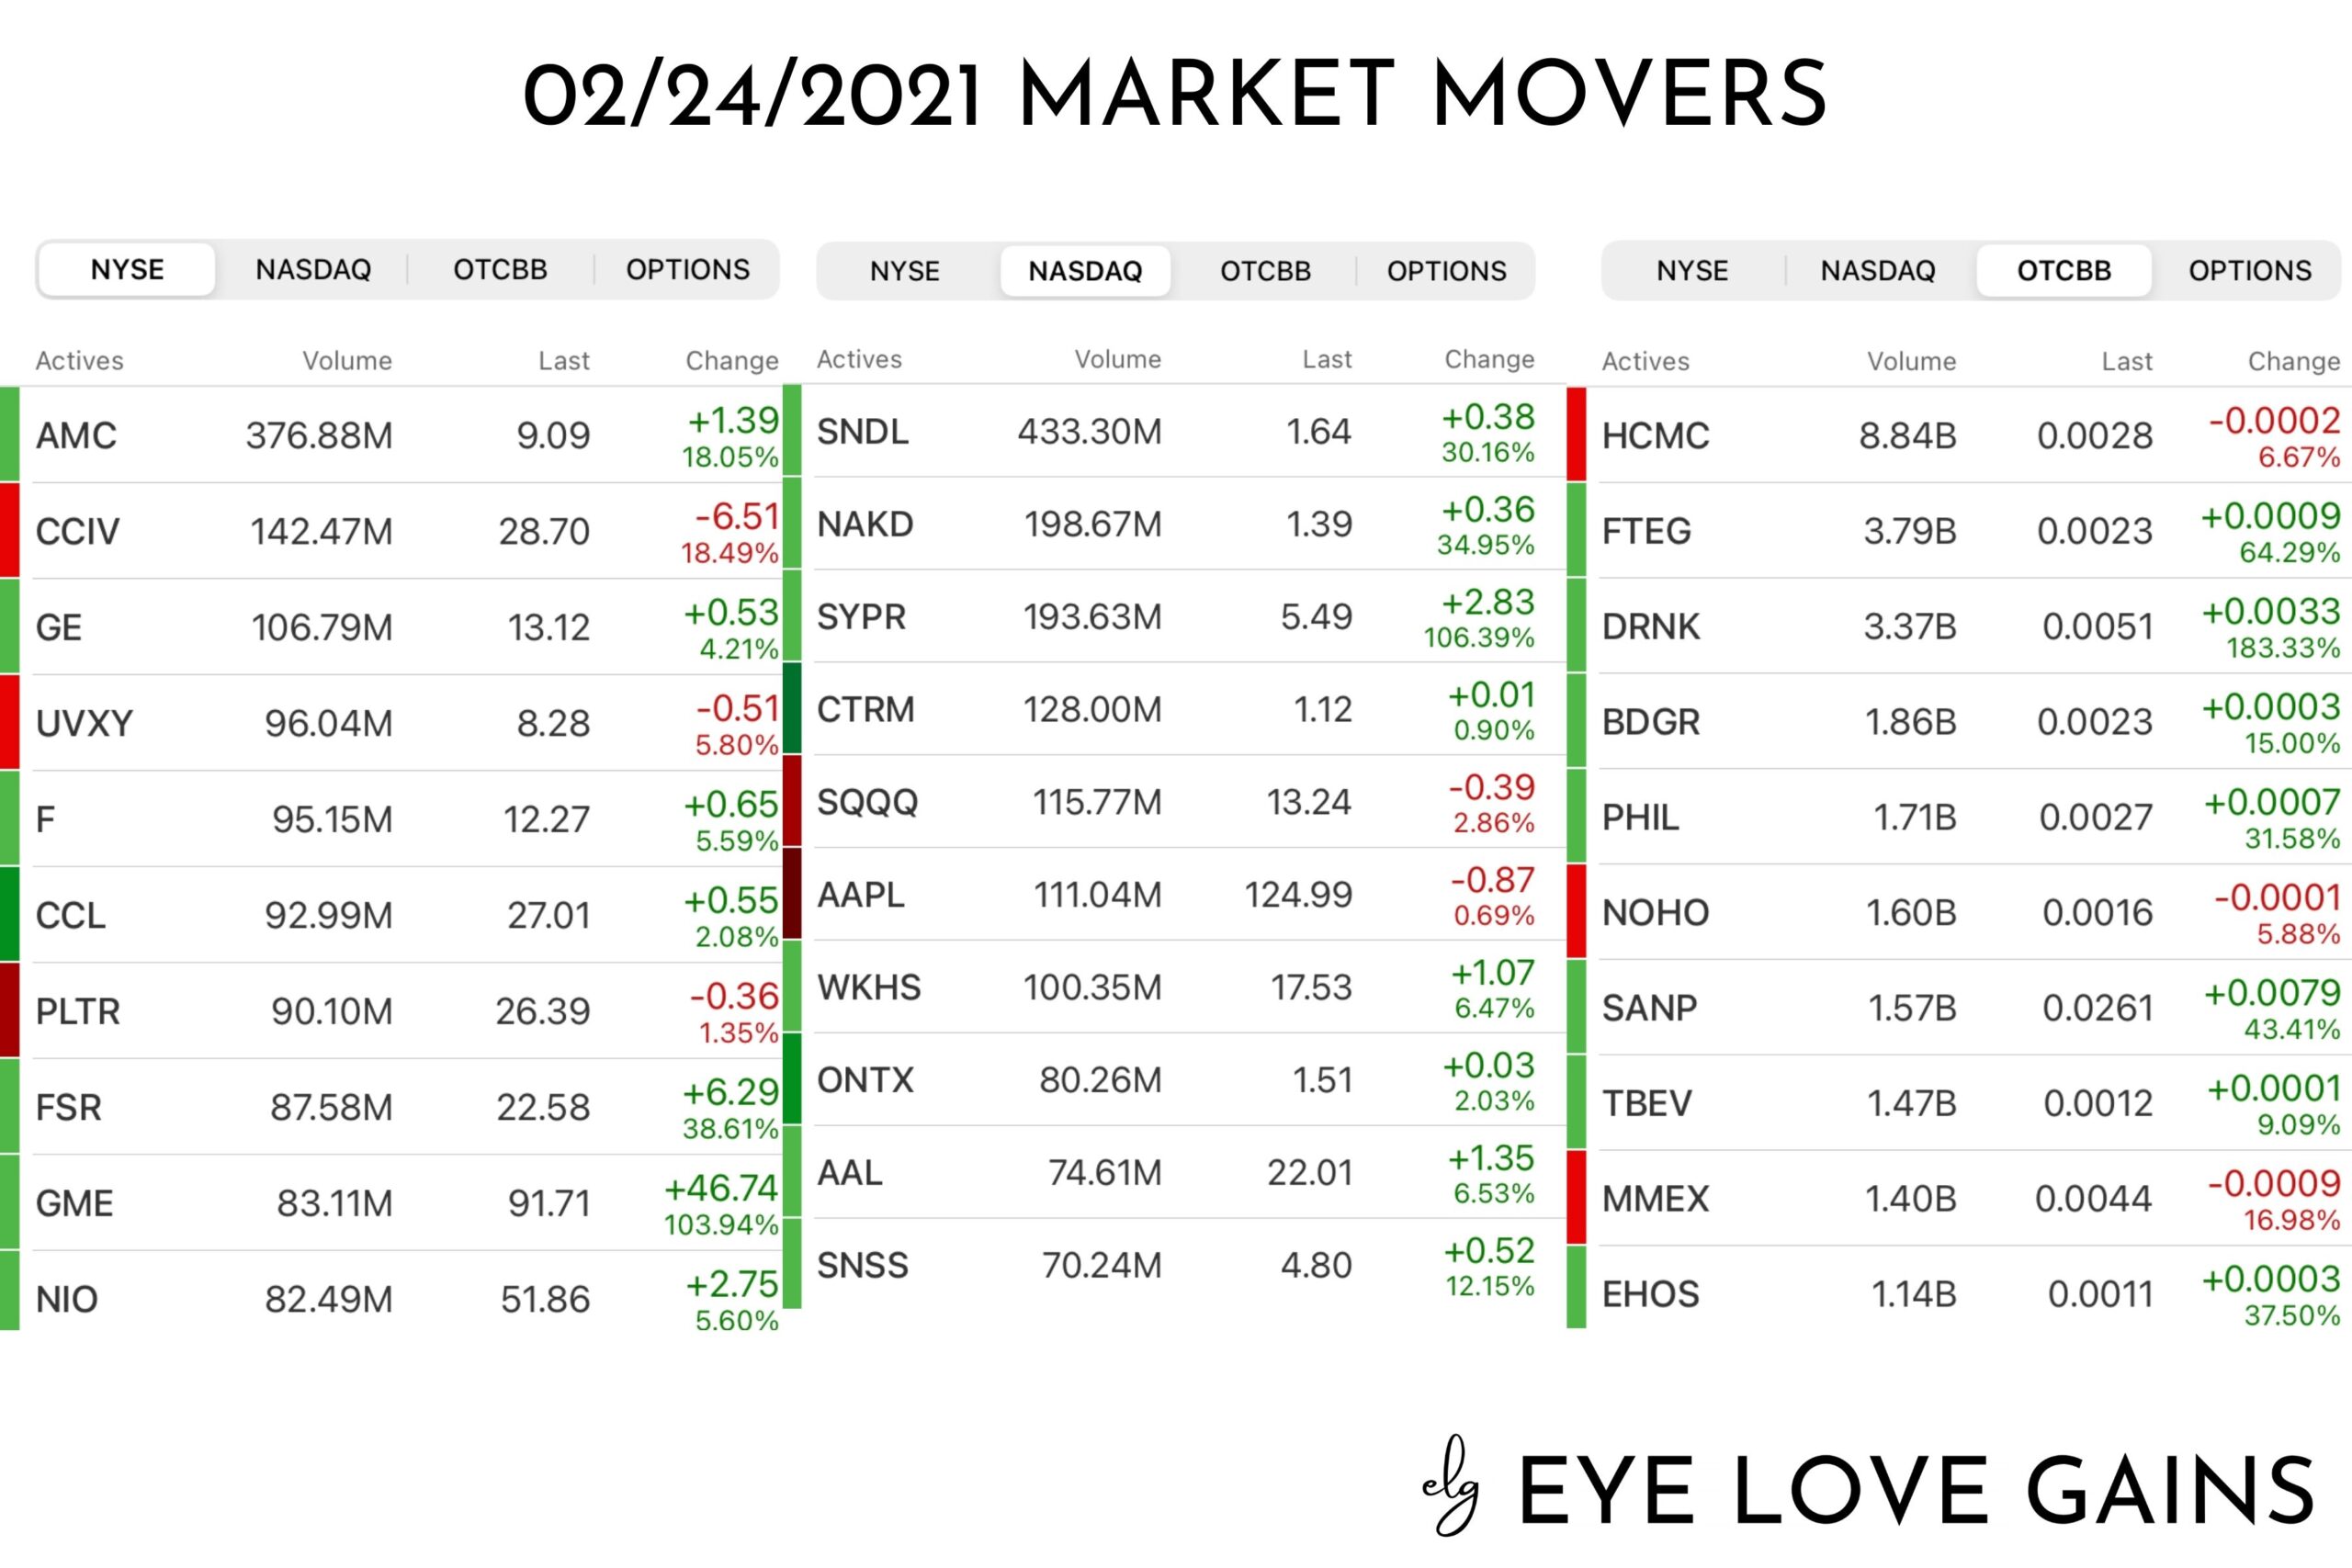
I monitor Market Movers every single day to scan for new setups. I mainly look for positions with unusual volume that are at the bottom, ready for a reversal back up, or if they remain green, I look for a bullish chart for a continuation.
As always, if you made some massive gains, be sure to support your local and small businesses. Be the change you wish to see in the world. Believe it or not, we can make a difference in keeping these businesses open!
Many have asked how to support me directly, you can open up a Webull Account with my referral link that’s on the sidebar & homepage or you can donate to my blog below via PayPal. Every bit helps to keep my blogging dream alive. I truly appreciate you taking the time to read.
-Cheers
Disclaimer : This should not be considered investment advice, and should not be used to make investment decisions. Do not buy or sell any stock without conducting your own due diligence. Information on eyelovegains.com is opinionated and should be considered for information purposes only. No stock exchange anywhere has approved or disapproved the information contained herein. There is no express or implied solicitation to buy or sell securities. The charts and data provided here are not meant for investment purposes and only serve as examples. We are not liable for any losses you may endure from the buying and selling of stocks or securities within your accounts.