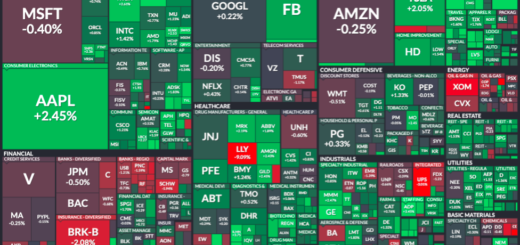
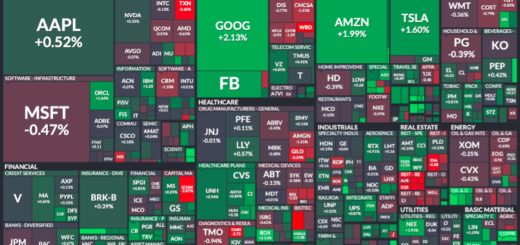
Watchlist 5/16/22-5/20/22 & Recap

Hi everyone,
I hope you’re ready to make some more money this week. With earnings getting wrapped up, this is the time to pay attention as investors tend to prepare to buy in slowly now that they have the full financial picture of each company. Keep a very close eye on oil stocks since Crude oil hit above $111 levels earlier today. I’ll be watching to see if it can break its highs above $120 levels in the coming week. Hope everyone has a great week! Stay positive and may all your accounts be blessed.
Manage Risks & Trading Plan Disclosure
These are my trading plans, and many ask if I’m holding this or that. If it breaks any of the dip zones that I mention or if it breaks the trend line for a swing on the 5D/30D chart, I will respect my rules and I will respect my stop loss and wait for the setup to re-enter. Never bag hold, never average down on a loser UNLESS you’re confident it will reverse, and never turn a day trade into a swing if you do not have a set plan. For those under PDT, be careful with setting up swings too early in the day; I prefer waiting until after lunch (EST) to set my swings up (unless it hit my perfect dip zone). Always make sure you have a day trade available in case you need to exit and reposition. It’s okay to be wrong, but it’s not okay to stay wrong. Hope doesn’t make us money; proper risk management does.
Many of these are great long term plays if one was to load up on red days while respecting the trend line for setting up swings. There’s nothing wrong with buying on green days if buying the BIG pullbacks. Best way to get burned is to chase while they’re ripping upward.
SSR triggered setups are my preferred setups for swinging. This does not mean that it cannot be shorted. If the volume is high, price action/momentum is there, with upcoming catalysts; then this is my preferred setup as someone who swings. I keep a mental stop in case I need to reposition my swing. Not every SSR trade will move up; there are many variables one must take into account when trading this type of setup.
I do NOT hold all stocks listed below. I provide a list of top mentions/trending/abnormal volume movers/upcoming catalysts/earnings/conservative large caps. You decide what you trade based on your preference.
5/16/22 Main Watch
If the market is red, consider respecting your stop losses. Stopping out doesn’t mean you’re unable to re-enter; it’s you giving yourself the best setup while managing your risks, and maximizing profit potential. Waiting for confirmation is crucial once it hits the dip zones; I would never just jump in and buy. It’s important they hold at the dip zone levels. If it breaks below, I typically wait for it to reclaim that dip zone before scaling in.
INDO
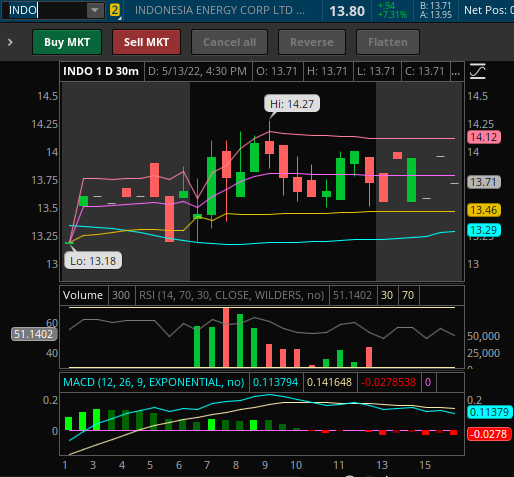
INDO hit low of day (LOD) $13.18 premarket and high of day (HOD) $14.27 intraday., closing at $13.80. If there is another pullback, watch for the dip zone to be at $13.29-$13.46 levels. Short Interest is 9.11% of float. INDO needs to reclaim $14.30 levels for a run back above $17-$22.50 levels. If crude oil is able to reclaim $120 levels, watch all oil plays for the move back up. Be careful swinging anything that’s been trading under $1 for greater than 30 days due to delisting/delinquency requirements.
BBIG

BBIG hit high of day (HOD) $2.90 premarket, and low of day (LOD) $2.51, closing at $2.60. BBIG hit $2.90 after hours. If there is another pullback, watch for the dip zone to be at $2.50-$2.55 levels. Short Interest is 21.91% of float. BBIG needs to reclaim $3.00 levels for a run back above $3.50. The momentum for BBIG is due to May 18, 2022 (this Wednesday) being the set record date for the dividend of shares of common stock of Cryptyde, Inc. View press release here. There is confusion on when the last day is to buy in; 5/16 or 5/18. To save yourselves the stress, assume that date is tomorrow and hold. Plus, it’s better you get in before it’s back above $3-$4 anyway…
GME

GME hit low of day (LOD) at $93.80 premarket and high of day (HOD) $106.78 intraday. If there is another pullback, watch for the dip zone to be at $92.48-$96.10 levels. GME needs to reclaim $110 levels, consolidate, and then reclaim $125 levels for the next leg back up above $136-$150 levels. The last time we dropped below $80 levels on 3/15/22, we ran back up to $200 levels on 3/29/22; that was a 2 week swing. Short Interest is 22.01% of float. Based on analysts, there is a high PT of $90, low PT of $23, and average PT of $47.67.
VRM


VRM hit low of day (LOD) $1.40 premarket and high of day (HOD) $1.75 intraday, closing at $1.60. VRM seems to have found support at $1.55-1.59 levels, forming higher lows. If there is another pullback, watch for the dip zone to be at $1.48-$1.57. The next leg is to reclaim $1.75, then break above $2.00. If VRM breaks the wall down at $2+ this week, $3-$5 levels will come end of week. The momentum is from Vroom reporting better-than-expected Q1 EPS and sales results. Based on 12 analysts, there is a high PT of $51, low PT of $2, and average PT of $8.71.
SBFM


SBFM hit low of day (LOD) $1.95 intraday and high of day (HOD) $2.30 after hours. SBFM closed at $2.00. If there is another pullback, watch for the dip zone to be at $1.96-$2.07 levels. The most recent news shows “Sunshine Biopharma S-3 Shows Registration ~14.6M Share Common Stock Shelf Offering Via Selling Shareholders, Co. will not receive proceeds from Offering.” Short Interest is 3.94% of float. SBFM needs to reclaim $2.50 levels for a run back above $3.
AGRI

AGRI hit low of day (LOD) $1.44 premarket and high of day (HOD) $1.70 after hours. AGRI closed at $1.67. If there is another pullback, watch for the dip zone to be at $1.53-$1.60 levels. The most recent news from Investor Relations shows “AgriFORCE Growing Systems Provides Update on Acquisition of Delphy, a Leading European Agriculture/Horticulture and AgTech Consulting Firm. View the full press release here. Short Interest is 0.46% of float. AGRI needs to reclaim $2.00 levels for a run back above $3.
CSCW

CSCW hit low of day (LOD) $0.1064 and high of day (HOD) $0.1359 intraday. CSCW closed at $0.13. If there is another pullback, watch for the dip zone to be at $0.12-$0.125 levels. Short Interest is 4.72% of float. CSCW needs to reclaim $0.1875 levels for a run back above $0.275, then the next leg up will be $0.50-$0.60 levels.

GHSI
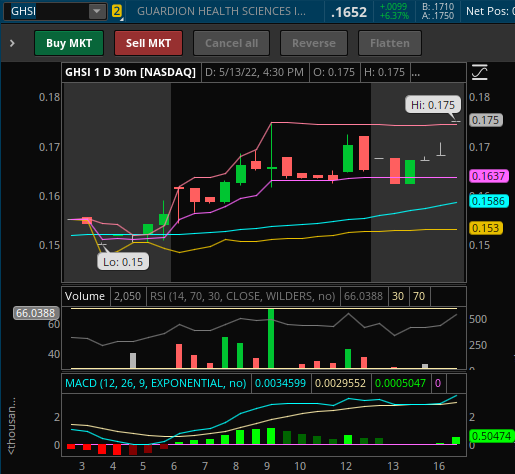
GHSI hit low of day (LOD) $0.15 premarket and high of day (HOD) $0.175 after hours. GHSI closed at $2.63. If there is another pullback, watch for the dip zone to be at $0.158-$0.162 levels. The momentum for Guardion Health Sciences is due to the company announcing “Financial Results for the Quarter Ended March 31, 2022 Viactiv® Generated Net Revenues of approximately $2.3 Million or 95% of Net Revenues for the Quarter Ended March 31, 2022.” You may view the full press release here. Short Interest is 10.23% of float. GHSI needs to reclaim $0.27 levels for a run back above $0.40. Once that level is reclaimed, we can focus on the move back to $0.60. Based on analysts, there is a PT of $0.60.
TNXP

TNXP hit low of day (LOD) $0.117 premarket and high of day (HOD) $0.138 after hours. TNXP closed at $0.1317. If there is another pullback, watch for the dip zone to be at $0.12-$0.128 levels. Short Interest is 8.45% of float. TNXP needs to reclaim $0.19 levels for a run back above $0.36. Once that level is reclaimed, we can focus on the bigger move back above $0.60. Based on analysts, there is a high PT of $3.00, low PT of $0.60, and average PT of $1.70.
Map from 5/13/22
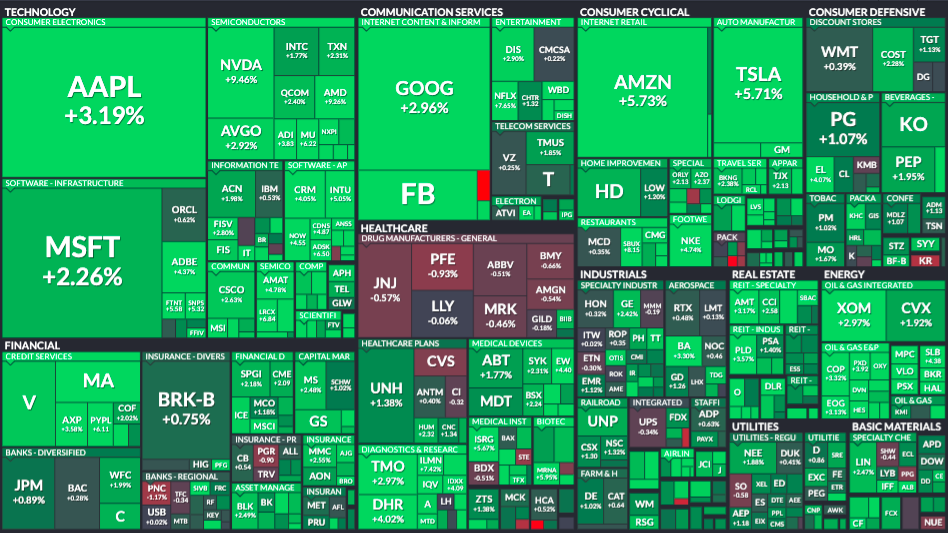
5/13/22 Setups Recap
I’ll be posting pre- and post- charts to see if our plan worked. I’ll show the percent changes from the dip zones so that you can see how there are plenty of gains to be made even in the small moves. It’s up to you when you take your profits. These will be used as archives so I can refer back to the chart year over year. This will also be used as learning tools to see where we went wrong so we can figure out the best way to maximize profits and manage risks. If none of these have moved yet, watch for the move to come in the coming weeks.
VRM
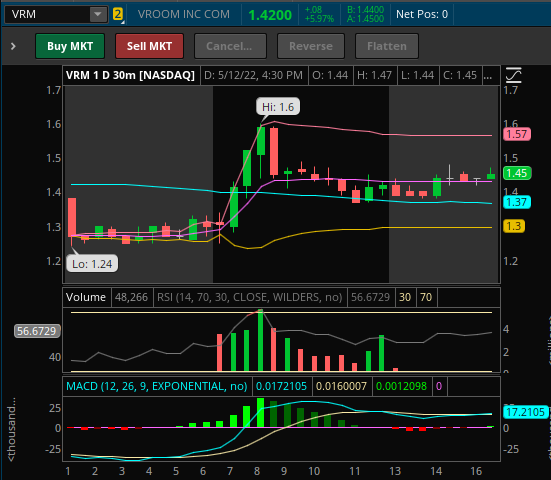

VRM hit low of day (LOD) $1.24 premarket and high of day (HOD) $1.60 intraday, closing at $1.42. VRM seems to have found support at $1.35-$1.40 levels, forming higher lows. If there is another pullback, watch for the dip zone to be at $1.38-$1.44. The next leg is to reclaim $1.50, then $1.60. If VRM breaks the wall down at $1.75, $2+ will come quickly. Next week we will aim for $3-$5 levels. The momentum is from Vroom reporting better-than-expected Q1 EPS and sales results. Based on 12 analysts, there is a high PT of $51, low PT of $2, and average PT of $8.71.
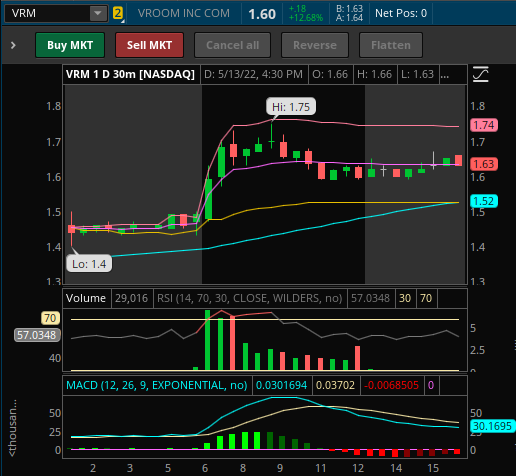
VRM hit low of day (LOD) at my dip zone ($1.38-$1.44) $1.40 (✓) premarket and moved $0.35 (25%) to high of day (HOD) $1.75 intraday, closing at $1.60. This is setting higher lows everyday, and we are not looking at the next leg up. If we can hold $1.75 levels next, $2-$2.50 levels will be next. This has been a multi-week swing at this point, as we try to get this to the average analyst PT of $8.71 over the next few months.
RBLX

Roblox reported earnings on 5/10/22 after hours, and held a conference call to review the earnings. You may view the press release here. After that call, the market responded positively, hitting high of day $28.37 on 5/11/22. Today it hit low of day (LOD) at $22.61 and high of day (HOD) $31.11. RBLX had a healthy pullback from the high of day (-13.85%) intraday to $26.80 levels, and it slowly climbed back up, forming the next leg, and closing at $29.68 after hours.
If there is another pullback, watch for the dip zone to be at $26.50-$27.99 levels. RBLX needs to reclaim $31 levels for the move back up above $35. After that leg is reclaimed, the next leg is $40-$45. Short Interest is 6.22% of float. Based on 21 analysts, there is a high PT of $103, low PT of $28, and average PT of $53.33.
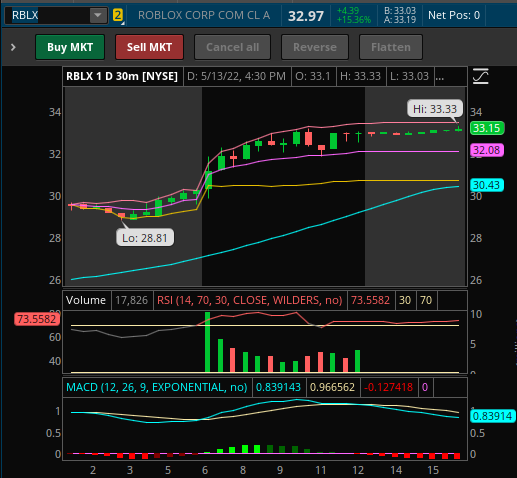
RBLX hit just $0.82 above my dip zone ($26.50-$27.99) at $28.81 (✓) and moving $4.52 (15.69%) hitting high of day (HOD) $33.33 after hours.
GME
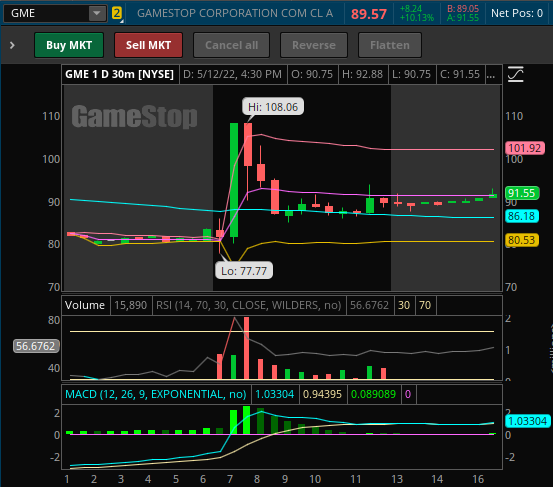
GME triggered SSR yesterday after 2 months of us trying to have it triggered. The last time we dropped below $80 levels on 3/15/22, we ran back up to $200 levels on 3/29/22; that was a 2 week swing. It hit low of day at $77.77, and was halted up three times to high of day (HOD) $108.06. If there is another pullback, watch for the dip zone to be at $83.07-$91.85 levels. GME needs to reclaim $110 levels, consolidate, and then reclaim $125 levels for the next leg back up above $136-$150 levels. Short Interest is 22.01% of float. Based on analysts, there is a high PT of $90, low PT of $23, and average PT of $47.67.
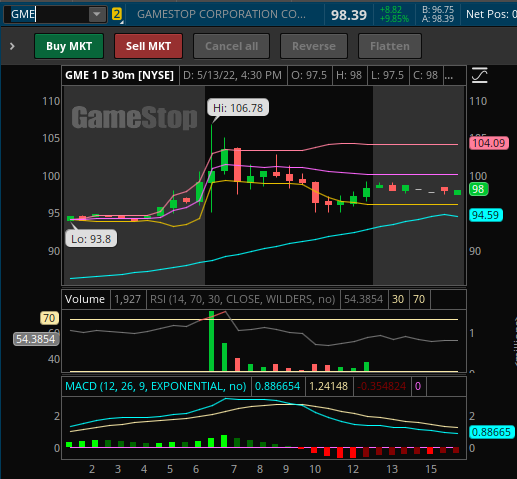
GME was a swing setup from 05/12/22 at the dip zone (83.07-91.85) (✓) and was able to hit $1.95 above that dip zone (83.07-91.85) again on 5/13/22, with a low of day (LOD) $93.80 (✓) moving $4.01 (13.84%) to high of day (HOD) $106.78.
BBIG
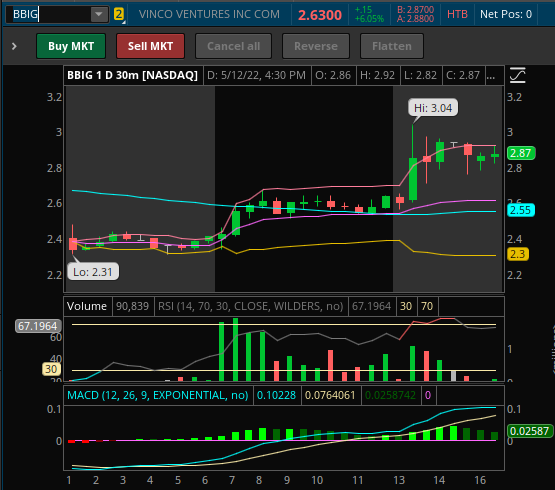
BBIG hit low of day (LOD) $2.31 and high of day (HOD) $3.04 after hours. BBIG closed at $2.63. If there is another pullback, watch for the dip zone to be at $2.57-$2.73 levels. Short Interest is 21.91% of float. BBIG needs to reclaim $3.25 levels for a run back above $4.

BBIG hit just $0.05 below my dipzone ($2.57-$2.73) at $2.51 and was able to reclaim the dip zone (✓) followed by a $0.39 (15.54%) run up to $2.90 after hours.
Others to Watch/Trending
- HOUR
- MDVL
- VERU
- KTRA
- PIXY
- RDBX
- AMZN
- AMD
- TSLA
- FCEL
- PIK
- BOLT
- MULN
- GFAI
- NILE
Oil/Gas Stocks to Watch for a Reversal
If trading oil, make sure you’re monitoring crude oil prices. Only load up on red days. If you chase the day it runs, you’re already too late. Your chances of losing money is much higher since it’s more volatile. Unless you’re a strong day trader, I would not try scalping an oil play. There are better setups elsewhere.
- INDO – 9.11% SI
- HUSA – 6.32% SI
- ENSV – 3.43% SI
- CEI – 9.59% SI
- USWS – 11.58% SI
- MXC – 4.74% SI
- MARPS – 3.20% SI
- IMPP – unknown SI
Earnings
5/16/22
- PIK
- WIX
- TSEM
- MNDY
- WEBR
- SOHU
- HOOK
- SNDL
- DAC
- HLBZ
5/17/22
- WMT
- HD
- JD
- ALLT
- PTN
- DOCS
- AGYS
- QUIK
- NXGN
- QTEK
5/18/22
- TGT
- ZIM
- LOW
- TJX
- ADI
- CSCO
- SNPS
- BBWI
- CPRT
- SQM
5/19/22
- KSS
- GOGL
- EXP
- MNRO
- CAE
- AMAT
- ROST
- PANW
- FLO
- GLOB
5/20/22
- FL
- BKE
- RLX
- ATEX
Many have asked how to support me directly, you can open up a Webull Account with my referral link that’s on the sidebar & homepage or you can donate to my blog below via PayPal. Every bit helps to keep my blogging dream alive. I truly appreciate you taking the time to read.
-Cheers
Disclaimer : This should not be considered investment advice, and should not be used to make investment decisions. Do not buy or sell any stock without conducting your own due diligence. Information on eyelovegains.com is opinionated and should be considered for information purposes only. No stock exchange anywhere has approved or disapproved the information contained herein. There is no express or implied solicitation to buy or sell securities. The charts and data provided here are not meant for investment purposes and only serve as examples. We are not liable for any losses you may endure from the buying and selling of stocks or securities within your accounts.

