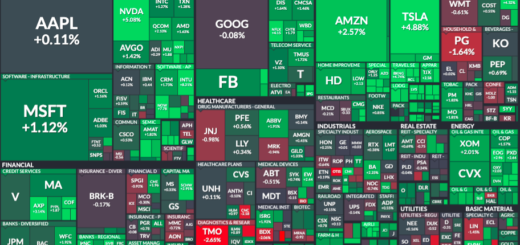
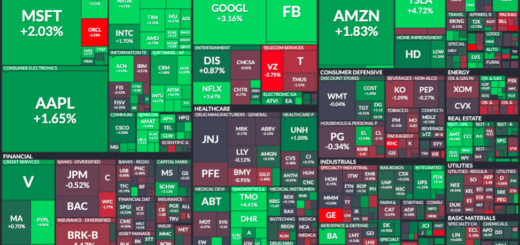
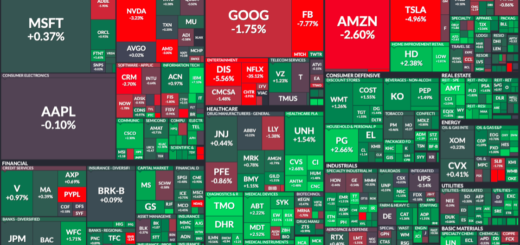
End of Day Wrap Up 03/17/2021
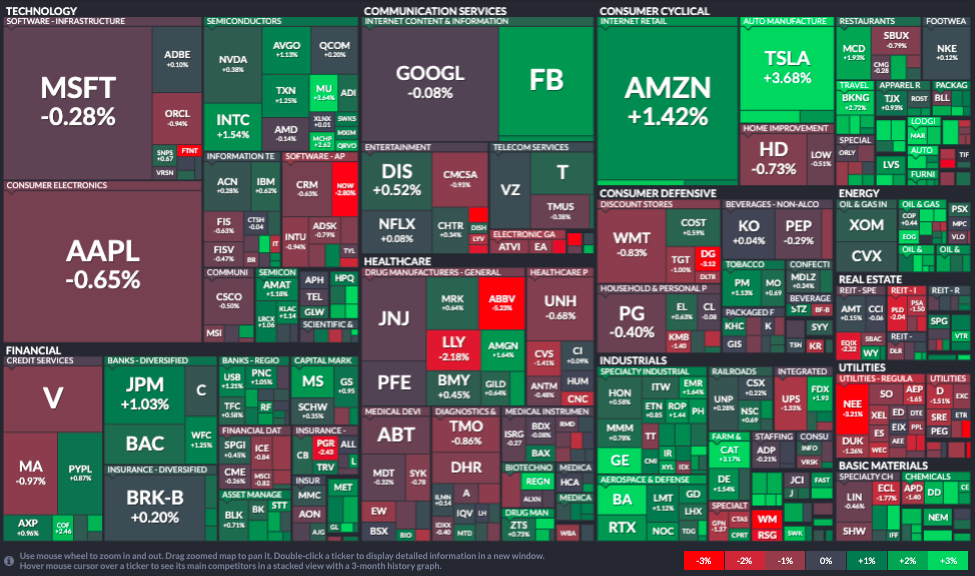
Happy Wednesday everyone. Today was a red at the beginning, and once we got halfway through the day, many of the red positions flipped green as I expected. Like I mentioned yesterday, once the stimulus money hits everyone’s bank accounts, we’ll be seeing green.

The Federal Reserve triggered an afternoon rally in the stock market after officials looked past inflation fears and kept rates unchanged. If you look at most charts, they look nearly identical in movement. Stocks that were red in the early morning spiked at pretty much the same exact time. If you look at the charts above for the DOW, NASDAQ, and S&P 500, that is pretty much what most of the charts looked like for the rest of the market day.
Onconova Therapeutics, Inc (ONTX)

ONTX, my long swing since last year, closed at $1.22, closing previously at $1.07. Its low of day was $1.13 and high of day was $1.31 with 54.83M in volume and a market cap of 291.03M.
SOS Limited American Depositary Shares (SOS)

SOS, my swing since a few weeks ago, closed at $7.81, closing previously at $7.15. Its low of day was $6.60 and high of day was $7.98 with 53.84M in volume and a market cap of 968.92M.
GameStop Corp (GME)

GME closed +0.79% at $209.81, hitting a high of day of $231.47. Its low of day was $204, closing at $211.49 after hours. Today’s volume was very low with 16.48M. As I’ve mentioned in my blog yesterday, I’ve been monitoring the price action extremely closely over the last 2 1/2 months, and I know something fishy is going on behind the scene. The pattern has become quite predictable. The goal over the next 4 trading days will be to trigger SSR every day.
(Repost from yesterday’s blog)
This may mean we will be allowing drops of -10% to -20% to trigger SSR every single day, but the goal is to buy the big dips and close higher each day, until 03/19-03/23. This is the setup we will need to execute to the T for us to get a great run.
GameStop will be announcing their Q4 2020 earnings on 03/23/2021 after the market closes. I’ll continue to sound like a broken record with GME, but there’s a good reason why GME is being suppressed, and it makes me want to hold it more based on the fact that they need to short it constantly to keep the price down. This is absolute insanity, because the psychology behind the charts patterns are reflective of two stubborn groups: Hedge Funds vs Retail Traders/Investors. I’ve been continuously taking my profits from my other trades, and buying more shares of GME every single day. I’m bullish, even if others don’t see it. The fact that dips get bought up as quickly as they do shows the power behind this stock. Others may just see a chart, but I know there’s much more to it, so I will stick with my gut on this one. As long as we’re holding above $200, and the monthly charts show higher lows forming over time, I’m holding. I don’t care if it looks messy, as long as we reach our destination. I’ll be happy with +1-3% gains daily over huge rips that don’t hold any day.
What I’ll be watching Thursday, 03/18/2021
I expect a green day tomorrow, with the stimulus money hitting accounts. I expect bullish momentum, but I will still trade conservatively just in case. It won’t matter what stocks you buy as long as you do your proper DD and set your positions up properly. All my red positions over the last month have flipped green, so I’ll be holding them for the movement back up. As always, stick to your plan, and do not chase your green.
How to Utilize My Positions List Below
Many ask how to utilize my top 5 green/red position lists below. Oftentimes, I will exit my green swing positions if it looks like there will be no continuation. My decision varies depending on what my cost price is. It’s all about managing risks, and if it looks like I’ll be in a position where, I’ll be down, I won’t hold, and will choose to reposition myself by accumulating dips on red days over a period of time until it’s ready for the next run.
To Buy On Green Days or Not
I will add to my green positions on green days only if it’s moving in the direction I like and forming higher lows, and showing a bullish chart. I make sure to scale when adding, especially on green days, because it can go south quickly.
To Buy on Red Days or Not
I will almost always accumulate my red positions because they usually move back up, unless it’s a clear pump and dump, which I will never swing because it’s too risky. If there are sharp spikes and a quick drop down, then it’s a clear pump and dump. If the chart slowly drops in price throughout the day, then that’s usually people taking profits. To make the call on re-entering or accumulating, I look at the 5D, 10D, 30D, 90D, 180D charts and I monitor the volume. I love adding when there’s little to no volume when setting up long swings.
Top 5 Green Positions (03/17/21):
- SAVA
- LYL
- ONTX
- MARA
- TSNPD
Top 5 Red Positions (03/17/21):
- HAON
- GEVO
- BLIAQ
- SRNE
- VTVT

I monitor Market Movers every single day to scan for new setups. I mainly look for positions with unusual volume that are at the bottom, ready for a reversal back up, or if they remain green, I look for a bullish chart for a continuation.
As always, if you made some massive gains, be sure to support your local and small businesses. Be the change you wish to see in the world. Believe it or not, we can make a difference in keeping these businesses open!
Many have asked how to support me directly, you can open up a Webull Account with my referral link that’s on the sidebar & homepage or you can donate to my blog below via PayPal. Every bit helps to keep my blogging dream alive. I truly appreciate you taking the time to read.
-Cheers
Disclaimer : This should not be considered investment advice, and should not be used to make investment decisions. Do not buy or sell any stock without conducting your own due diligence. Information on eyelovegains.com is opinionated and should be considered for information purposes only. No stock exchange anywhere has approved or disapproved the information contained herein. There is no express or implied solicitation to buy or sell securities. The charts and data provided here are not meant for investment purposes and only serve as examples. We are not liable for any losses you may endure from the buying and selling of stocks or securities within your accounts.

