Watchlist 5/19/22 & Recap
Manage Risks & Trading Plan Disclosure
These are my trading plans, and many ask if I’m holding this or that. If it breaks any of the dip zones that I mention or if it breaks the trend line for a swing on the 5D/30D chart, I will respect my rules and I will respect my stop loss and wait for the setup to re-enter. Never bag hold, never average down on a loser UNLESS you’re confident it will reverse, and never turn a day trade into a swing if you do not have a set plan. For those under PDT, be careful with setting up swings too early in the day; I prefer waiting until after lunch (EST) to set my swings up (unless it hit my perfect dip zone). Always make sure you have a day trade available in case you need to exit and reposition. It’s okay to be wrong, but it’s not okay to stay wrong. Hope doesn’t make us money; proper risk management does.
Many of these are great long term plays if one was to load up on red days while respecting the trend line for setting up swings. There’s nothing wrong with buying on green days if buying the BIG pullbacks. Best way to get burned is to chase while they’re ripping upward.
If these don’t run yet, and are holding new support levels, especially at my dip zone, assume I’m accumulating, and holding for a bigger move. I mainly set swings up as soon as I see signs of a reversal with anticipation of catalysts. From the original alert, expect my multi-week swings to run at least 100% with pullbacks in-between.
I provide my watchlists for all types of traders. If you’re conservative, consider anything $50 and up; if you have higher risk tolerance, consider penny stocks below $2; if you’re in the middle, consider anything between $2-$50.
SSR triggered setups are my preferred setups for swinging. This does not mean that it cannot be shorted. If the volume is high, price action/momentum is there, with upcoming catalysts; then this is my preferred setup as someone who swings. I keep a mental stop in case I need to reposition my swing. Not every SSR trade will move up; there are many variables one must take into account when trading this type of setup.
I do NOT hold all stocks listed below. I provide a list of top mentions/trending/abnormal volume movers/upcoming catalysts/earnings/conservative large caps. You decide what you trade based on your preference.
5/19/22 Main Watch
If the market is red, consider respecting your stop losses. Stopping out doesn’t mean you’re unable to re-enter; it’s you giving yourself the best setup while managing your risks, and maximizing profit potential. Waiting for confirmation is crucial once it hits the dip zones; I would never just jump in and buy. It’s important they hold at the dip zone levels. If it breaks below, I typically wait for it to reclaim that dip zone before scaling in.
AGRI

Day’s Volume: 57,041,774
Average 10 Day Volume: 16.66M
Day’s range: $2.58-$3.13
AGRI hit low of day (LOD) $2.53 premarket and high of day (HOD) $3.34 premarket. AGRI closed at $2.92. Short Interest is 0.46% of float. If there is another pullback, watch for the dip zone to be at $2.54-$2.67. AGRI needs to reclaim $3.00 levels for a run back above $3.50, consolidate, for the next leg to $4-$5.
Catalyst:
- “AgriFORCE Growing Systems Completes Acquisition of Food Production & Processing IP from Manna Nutritional Group (MNG)” 5/18/22 View full press release here.
- Quarterly report pursuant to Section 13 or 15(d) (10-Q). 5/16/22/ View sec-filing here.
- “AgriFORCE Growing Systems Provides Update on Acquisition of Delphy, a Leading European Agriculture/Horticulture and AgTech Consulting Firm. 5/12/22. View the full press release here.
- AgriFORCE is presenting at “Microcap Rodeo’s Spring into Action Best Ideas Virtual Conference on May 17th.” Management is scheduled to present on Tuesday, May 17, 2022 at 3:00 p.m. ET. The presentation will be webcast live and available for replay https://www.webcaster4.com/Webcast/Page/2882/45580. 5/11/22. View the full press release here.
- Agriculture stocks are a very hot sector and Agriforce is one of the main leaders according to what’s trending across discords and most mentions.
VERU

Day’s Volume: 26,685.708
Average 10 Day Volume: 29.17M
Day’s range: $13.72-$16.37
VERU hit high of day $16.70 premarket and low of day (LOD) $13.72 intraday, and closed at $15.01. If there is a pullback, watch for the dipzone to be at $14.19-$14.63. SSR was triggered and will be on Thursday, May 19th. VERU needs to reclaim $15.50 levels, consolidate for a bullish move up to $16-$17, consolidate, upward, and break above $20+.
Veru is consistent with their PRs as you’ll see below. A company that has consistent PRs is one that I keep an eye on because you can depend on them to have strong catalysts when swinging long.
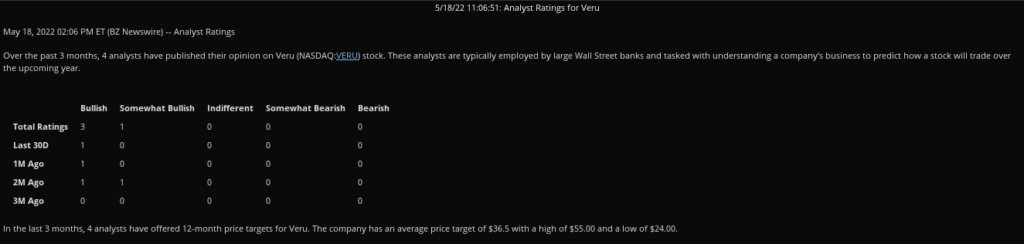

If shorts try to scare you about offerings, you should consider looking at a company’s history and patterns. I’ll look at the chart and line it up with offering dates. Every company has a pattern, and in the past Veru has only dropped offerings approximately 1-2 weeks after hitting Analyst PTs. Unlike other companies in need of cash quickly, who drop offerings at the bottom, Veru Inc. has recognized there’s a lot to be made by allowing investors and traders build up their stock price so they can raise money towards growing their company and to continue giving their shareholders results. As you’ll see from the last 3 months of press releases, their 2022 pipeline is strong.
Catalysts:
- Veru Announces Appointment of Joel Batten to Lead U.S. Infectious Disease Franchise to Focus on Hospitalized COVID-19 Patients. 5/18/22 View the full press release here.
- Veru to Present at the H.C. Wainwright Global Investment Conference on May 24th 2022. 5/17/22. View the full press release here.
- Veru Reports Second Quarter Fiscal 2022 Results and Progress of Sabizabulin for COVID-19 Toward a Request for Emergency Use Authorization. 5/12/22. View the full press release here.
- FDA States that Veru Should Submit Request for Emergency Use Authorization (EUA) Based on Positive Efficacy and Safety Data from the Phase 3 Clinical Study of Sabizabulin in Hospitalized COVID-19 Patients. 5/11/22. View the full press release here.
- FDA Has Granted Veru a Pre-Emergency Use Authorization (EUA) Meeting Date for Positive Sabizabulin Phase 3 COVID-19 Study. 5/2/22. View the full press release here.
- Veru Announces Oral Late-Breaking Presentation of Phase 2 Data of Sabizabulin for the Treatment of Hospitalized Severe COVID-19 Patients at High Risk for Acute Respiratory Distress Syndrome at the 32nd European Congress of Clinical Microbiology & Infectious Diseases. 4/25/22. View the full press release here.
- Veru’s Novel COVID-19 Drug Candidate Reduces Deaths by 55% in Hospitalized Patients in Interim Analysis of Phase 3 Study; Independent Data Monitoring Committee Halts Study Early for Overwhelming Efficacy. 4/11/22. View the full press release here.
INDO

Day’s Volume: 679,014
Average 10 Day Volume: 1.80M
Day’s range: $15-$17.49
INDO hit high of day $17.98 premarket and low of day (LOD) $13.72 intraday, closing at $15.80. If there is another pullback, watch for the dip zone to be at $15.01-$15.23 levels. Short Interest is 9.11% of float. INDO needs to reclaim $18-$19 levels for a run back above $20, consolidate, and then push for the next leg to $25-$30 levels. If crude oil is able to reclaim $120 levels in the coming weeks, watch all oil plays for the move back up. Be careful swinging anything that’s been trading under $1 for greater than 30 days due to delisting/delinquency requirements or reverse splits.
Catalyst:
Moves with Crude Oil

SKYH
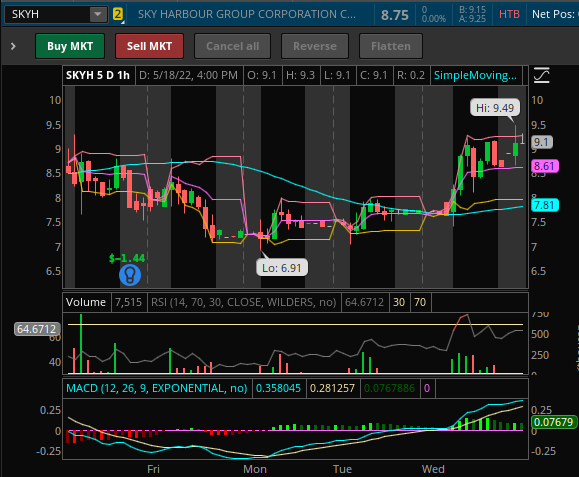
Day’s Volume: 1,337,076
Average 10 Day Volume: 2.23M
Day’s range: $7.40-$9.20
SKYH hit low of day (LOD) $7.40 intraday and high of day (HOD) $9.49 after hours. If there is a pullback, watch for the dip zone at $7.87-$8.31. If it breaks below, watch for the second dip zone at $7.50-7.86 levels. Short Interest is 4.37% of float.
CEI

Day’s Volume: 20,732,027
Average 10 Day Volume: 22.99M
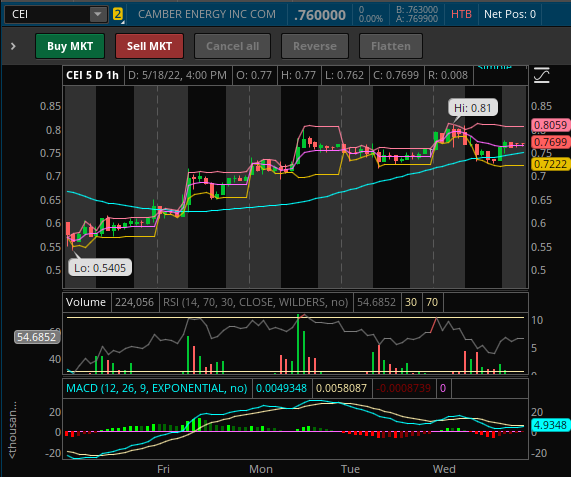
Day’s range: $0.7268-$0.8080
CEI hit high of day (HOD) $0.81 premarket and low of day (LOD) $0.72.68 intraday, closing at $0.76. If there is another pullback, watch for the dip zone to be at $0.73-$0.7695. This has been a multi-day swing and will likely be a multi-week swing with all the catalysts lining up. CEI will need to reclaim $0.80 levels, then break above $0.85 for a run above $0.90+.
Catalysts:
- 10-Q/A Sec-Filing QUARTERLY REPORT PURSUANT TO SECTION 13 OR 15(D). 5/18/22 View filing here.
- 10-K/A Sec-Filing ANNUAL REPORT PURSUANT TO SECTION 13 AND 15(D). 5/18/22 View filing here.
- 10-Q/A Sec-Filing QUARTERLY REPORT PURSUANT TO SECTION 13 OR 15(D). 5/18/22 View filing here.
- SC 13G/A Sec-Filing SCHEDULE FILED TO REPORT ACQUISITION OF BENEFICIAL OWNERSHIP OF 5% OR MORE OF A CLASS OF EQUITY SECURITIES BY PASSIVE INVESTORS AND CERTAIN INSTITUTIONS. 5/17/22 View filing here.
- NT 10-Q Sec-Filing. 5/17/22 View filing here.
5/18/22 Setups Recap
If the market is red, consider respecting your stop losses. Stopping out doesn’t mean you’re unable to re-enter; it’s you giving yourself the best setup while managing your risks, and maximizing profit potential. Waiting for confirmation is crucial once it hits the dip zones; I would never just jump in and buy. It’s important they hold at the dip zone levels. If it breaks below, I typically wait for it to reclaim that dip zone before scaling in.
INDO

INDO hit low of day (LOD) $17.14 premarket and high of day (HOD) $20.47 intraday, closing at $16.68. After hours, it moved another $0.32, closing at $17. If there is another pullback, watch for the dip zone to be at $16.10-$16.60 levels. Short Interest is 9.11% of float. INDO needs to reclaim $18.75-$19 levels for a run back above $20, consolidate, and then push for the next leg to $25-$30 levels. If crude oil is able to reclaim $120 levels, watch all oil plays for the move back up. Be careful swinging anything that’s been trading under $1 for greater than 30 days due to delisting/delinquency requirements or reverse splits.
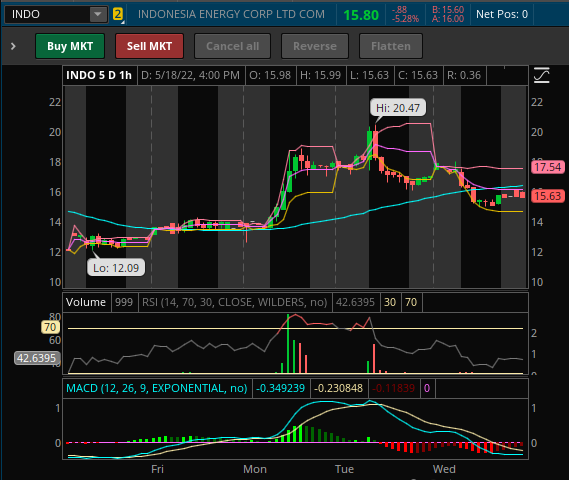
INDO hit high of day (HOD) $17.98 premarket and low of day (LOD) $15 intraday. It dropped due to crude oil falling, along with the whole market being red.
PIXY
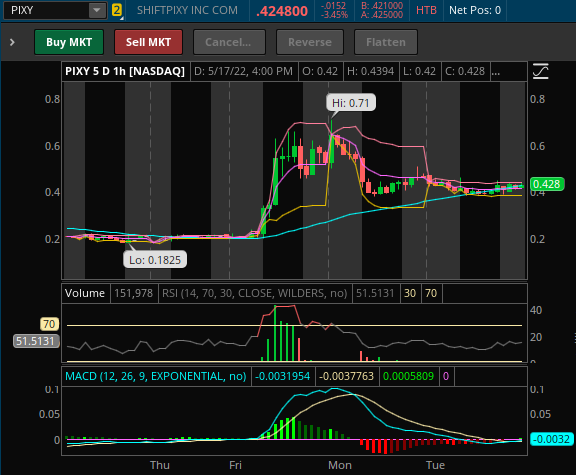
PIXY hit high of day (HOD) $0.46 at the open and faded to low of day (LOD) $0.3841 intraday, closing at $0.4248. If there is another pullback, watch for the dip zone to be at $0.40-$0.414 levels. SSR will be on for Wednesday 5/18/22. Short Interest is 4.07% of float. PIXY needs to reclaim $0.50-$0.55 levels for a run back above $0.60-$0.75 levels.
Catalyst:
“Special Distribution of Shares of Industrial Human Capital, Inc.” You may view the full press release here. Board of Directors (the “Board”) approved a special distribution to ShiftPixy shareholders in the form of shares of common stock of Industrial Human Capital, Inc. (NYSE: AXH), the special purpose acquisition company, or “SPAC”, in which ShiftPixy currently owns an approximate 15% ownership stake. All ShiftPixy shareholders of record as of May 17, 2022, will receive their pro rata share of AXH common stock equal in proportion to their percentage holdings of ShiftPixy common stock issued and outstanding

PIXY hit low of day (LOD) $0.3842 and was able to reclaim my dip zone ($0.40-$0.414) (✓) moving up $0.06 (15%) to high of day (HOD) $0.46, closing at $0.3998. It was unable to break above $0.50 for a bigger move, so the swing continues until we get back above $0.60-$0.75 levels.
ASNS

ASNS hit high of day (HOD) $2.50 premarket and low of day (LOD) $1.80 intraday, closing at $1.95. If there is another pullback, watch for the dip zone to be at $1.80-$2.00. It will need to reclaim $2.50 levels for a move up into the $4+ range.

ASNS hit high of day (HOD) $2.03 premarket and faded into a low of day (LOD) $1.81, hitting my dip zone ($1.80-$2.00) but it did not make any significant moves due to low volume.
CEI
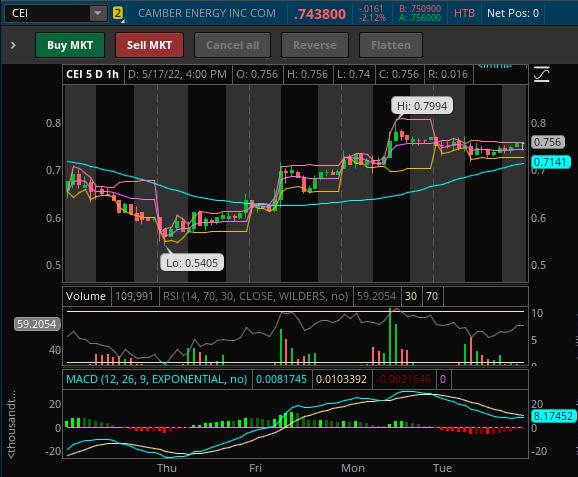
CEI hit low of day (LOD) $0.7151 and high of day (HOD) $0.77 intraday, closing at $0.7438. If there is another pullback, watch for the dip zone to be at $0.7175-$0.735. CEI will need to reclaim $0.80 levels, then break above $0.85 for a run above $0.90+.
Catalyst:
- SC 13G/A Sec-Filing SCHEDULE FILED TO REPORT ACQUISITION OF BENEFICIAL OWNERSHIP OF 5% OR MORE OF A CLASS OF EQUITY SECURITIES BY PASSIVE INVESTORS AND CERTAIN INSTITUTIONS. View filing here.
- NT 10-Q Sec-Filing. View filing here.
CEI hit high of day (HOD) $0.81 and faded into a low of day (LOD) $0.7268, hitting my dip zone ($0.7175-$0.7350) (✓) and moving back up $0.332 (4.57%) into $0.76 levels to continue the swing. It was unable to break above $0.85 for a bigger move, so the swing continues to $0.90+.
AGRI
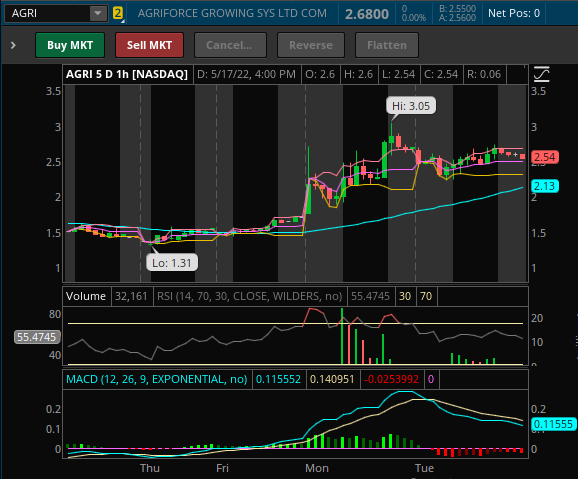
AGRI hit $0.01 below my 2nd dip zone ($2.24-$2.40) $2.23 (✓) premarket. It moved $0.50 (22.3%), hitting high of day (HOD) $2.74 intraday, closing at $2.68. Watch for pullback between $2.47-$2.60 levels. AGRI is under SSR Wednesday. Needs to consolidate above $3-$3.25 for $4+.
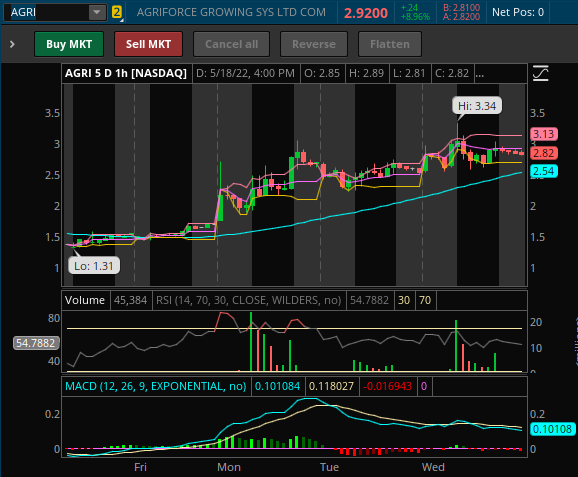
AGRI hit my dip zone ($2.47-$2.60) $2.53 (✓) premarket. AGRI dropped news, “AgriFORCE Growing Systems Completes Acquisition of Food Production & Processing IP from Manna Nutritional Group (MNG)” View full press release here. which allowed it to move $0.81 (32.02%), hitting high of day (HOD) $3.34 premarket, pulling back to low of day (LOD) $2.58, and closing at $2.92. The swing continues until we get back to $6+.
BBIG

BBIG hit high of day (HOD) $2.90 premarket, and low of day (LOD) $2.51, closing at $2.60. BBIG hit $2.90 after hours. If there is another pullback, watch for the dip zone to be at $2.50-$2.55 levels. Short Interest is 21.91% of float. BBIG needs to reclaim $3.00 levels for a run back above $3.50.
Catalyst:
May 18, 2022 (this Wednesday) being the set record date for the dividend of shares of common stock of Cryptyde, Inc. View press release here. There is confusion on when the last day is to buy in; 5/16 or 5/18. To save yourselves the stress, assume that date is tomorrow and hold. Plus, it’s better you get in before it’s back above $3-$4 anyway…
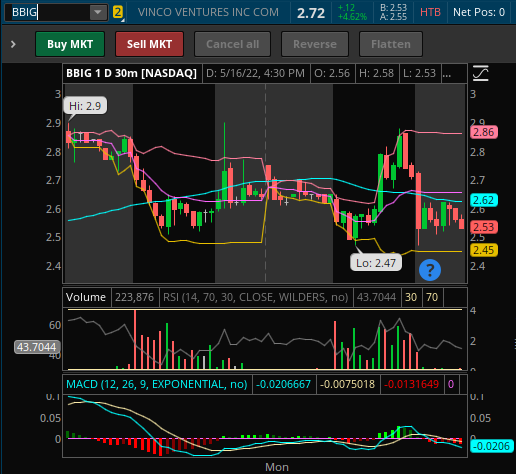
BBIG hit low of day (LOD) $2.47, $0.03 below my dip zone, but it was able to reclaim my dip zone twice: ($2.50-$2.55)(✓) intraday moving $0.36 (14.4%) to high of day (HOD) $2.86 intraday, closing at $2.72 and again after hours, moving $0.12 (4.8%) from $2.50 to $2.62. BBIG needs to reclaim $3 for a move back above $4 levels.

BBIG was a continued swing from the previous week. It hit low of day (LOD) $2.59, closed at $2.86, and hit high of day (HOD) $3.13 after hours (✓). BBIG needs to reclaim $3 and consolidate for a move back above $4 levels. If there is pullback, watch for a dip zone at $2.70-$2.81.
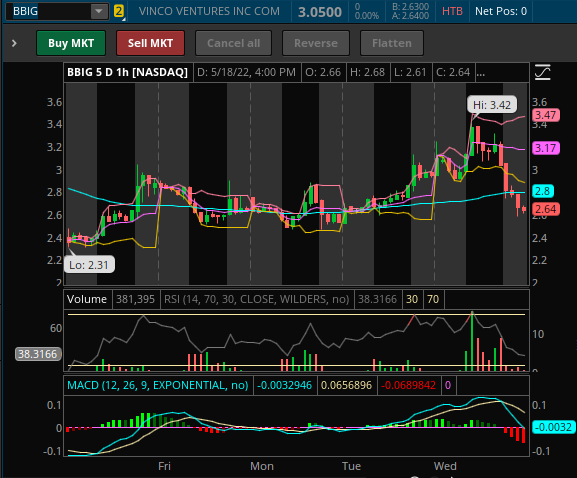
BBIG hit $0.09 above my dipzone ($2.70-$2.81) at $2.90 (✓) premarket and moved $0.52 (17.93%) to $3.42, closing at $3.05. As soon as the market closed, everyone dumped their shares. If BBIG opens below $2.74, this can potentially become an SSR swing setup. We shall see how the price action looks tomorrow. I’m holding my full position. We still haven’t broke above $5-$6; and I don’t sell at the bottom.
GME

GME hit low of day (LOD) $91.20 and hit high of day (HOD) $103 after hours. I’m still swinging my full position from last week. GME needs to reclaim $110 levels, consolidate, and then reclaim $125 levels for the next leg back up above $136-$150 levels. If there is a pullback, watch for the dip zone ($92.70-$96).
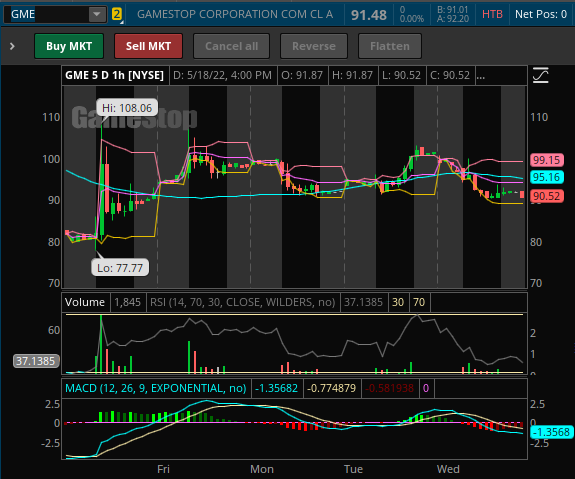
GME hit high of day (HOD) $100.70 premarket and faded to low of day (LOD) $90.01 after hours. SSR was triggered for Thursday, 5/19/22, so if the right volume pours in, we might be able to break about $120 this time. Last week we triggered SSR at ~$80 and was able to hit ~$108 levels the following day.
Others to Watch/Trending
- VRM
- PIK
- INO
- SLRX
- HOUR
- CARV
- LGVN
- AMC
- DTST
- RDBX
- FCEL
- ATER
- BLU
- BRQS
- XELA
- CSCW
- GFAI
- NILE
- GHSI
- AUMN
- SONM
Oil/Gas Stocks to Watch for a Reversal
If trading oil, make sure you’re monitoring crude oil prices. Only load up on red days. If you chase the day it runs, you’re already too late. Your chances of losing money is much higher since it’s more volatile. Unless you’re a strong day trader, I would not try scalping an oil play. There are better setups elsewhere. Be careful swinging anything that’s been trading under $1 for greater than 30 days due to delisting/delinquency requirements or reverse splits; I’d keep them as day trades if uncertain.
- INDO – 9.11% SI
- HUSA – 6.32% SI
- ENSV – 3.43% SI
- CEI – 9.59% SI
- USWS – 11.58% SI
- MXC – 4.74% SI
- MARPS – 3.20% SI
- IMPP – unknown SI
Earnings
5/19/22
- KSS
- GOGL
- EXP
- MNRO
- CAE
- AMAT
- ROST
- PANW
- FLO
- GLOB
5/20/22
- FL
- BKE
- RLX
- ATEX
Many have asked how to support me directly, you can open up a Webull Account with my referral link that’s on the sidebar & homepage or you can donate to my blog below via PayPal. Every bit helps to keep my blogging dream alive. I truly appreciate you taking the time to read.
-Cheers
Disclaimer : This should not be considered investment advice, and should not be used to make investment decisions. Do not buy or sell any stock without conducting your own due diligence. Information on eyelovegains.com is opinionated and should be considered for information purposes only. No stock exchange anywhere has approved or disapproved the information contained herein. There is no express or implied solicitation to buy or sell securities. The charts and data provided here are not meant for investment purposes and only serve as examples. We are not liable for any losses you may endure from the buying and selling of stocks or securities within your accounts.